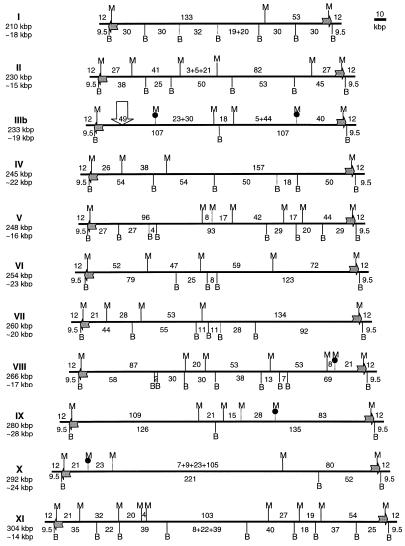
Figure 3.
Restriction map of the E.cuniculi genome. The 11 chromosomes are represented horizontally. Chromosome size and mean distance between two successive MluI or BssHII sites are indicated on the left. MluI sites (M) are marked above each chromosome and BssHII sites (B) below. Numbers between successive sites stand for the size interval in kb, as determined by KARD-PFGE. Vertical bars represent sites placed with DDIC-PFGE (solid lines) and rDNA hybridisation experiments with partially (dotted lines) or fully digested DNA (dotted lines topped by a black circle) on KARD-PFGE gels. Uncertain sites are represented with a cross. Horizontal arrows depict the rDNA units placed above when transcribed from the Watson strand or below when transcribed from the Crick strand. Only the longest chromosome III (IIIb) is shown; a 3-kb deletion in the 49-kb MluI fragment (vertical arrow) is characteristic of its homologue.

