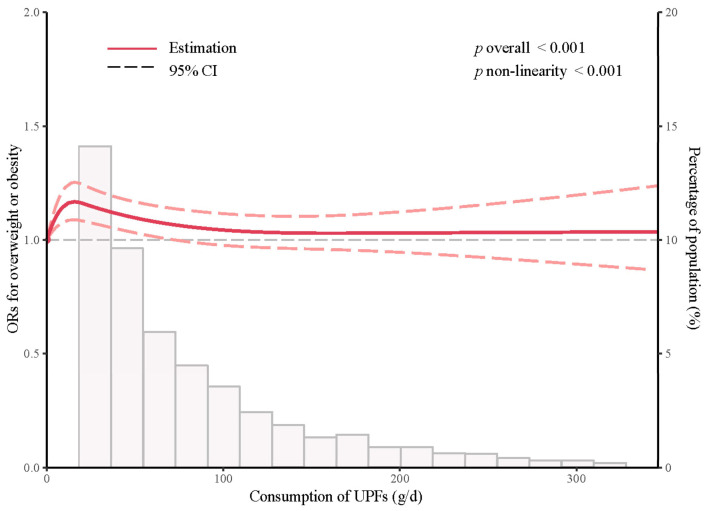
Figure 2.
Association of UPF consumption and ORs of overweight or obesity. Red solid line shows ORs estimated after being adjusted for gender, age, education level, individual annual income, occupation, alcohol drinking status, labor intensity, geographical location, total energy intake, dietary protein, fat, carbohydrate, vitamin A, vitamin C, calcium, and sodium; pink-dashed lines indicate 95% CIs.

