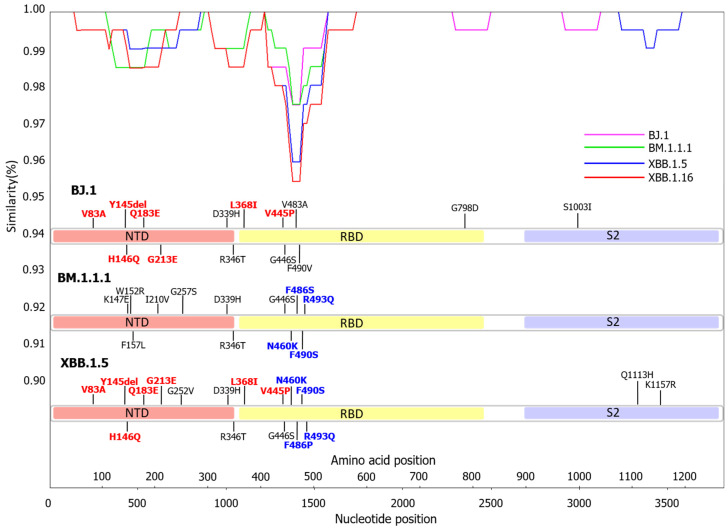
Figure 2.
Similarity plot analysis of SARS-CoV-2 Omicron subvariants were conducted. The results of the SimPlot analysis are shown in pink for BJ.1, green for BM.1.1.1, blue for XBB.1.5, and red for XBB.1.16. Nucleotide sequences of the BA.2, BJ.1, BM.1.1.1, and XBB.1.5 strains used in the analysis were compared. The mutations that match between BJ.1 and XBB.1.5 are shown in red. The mutations that match between BM.1.1.1 and XBB.1.5 are shown in blue.

