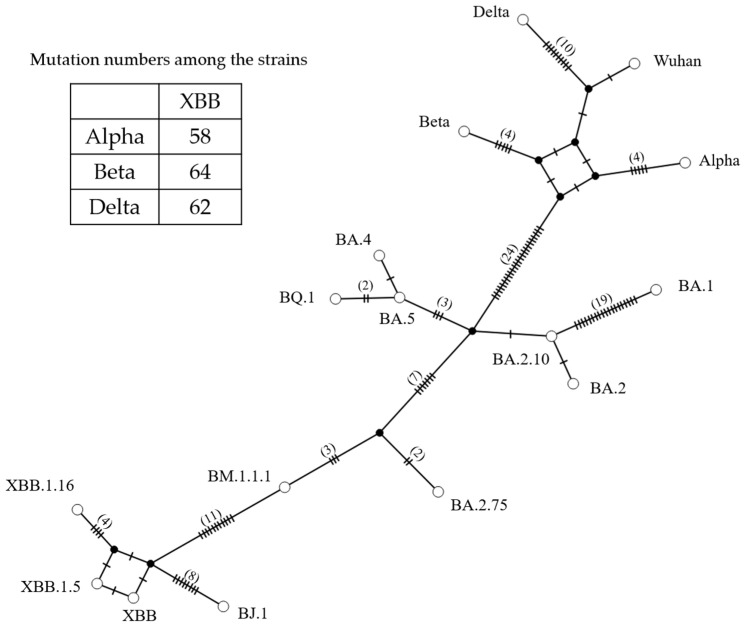
Figure 3.
SARS-CoV-2 variant S gene constructed using genome network analysis. Each circle represents a haplotype, and the number of branch bars connecting the haplotypes and the number in parentheses represents the number of different bases between haplotypes. The numbers in the table of this figure indicate the numbers of nucleotide substitutions among the strains.

