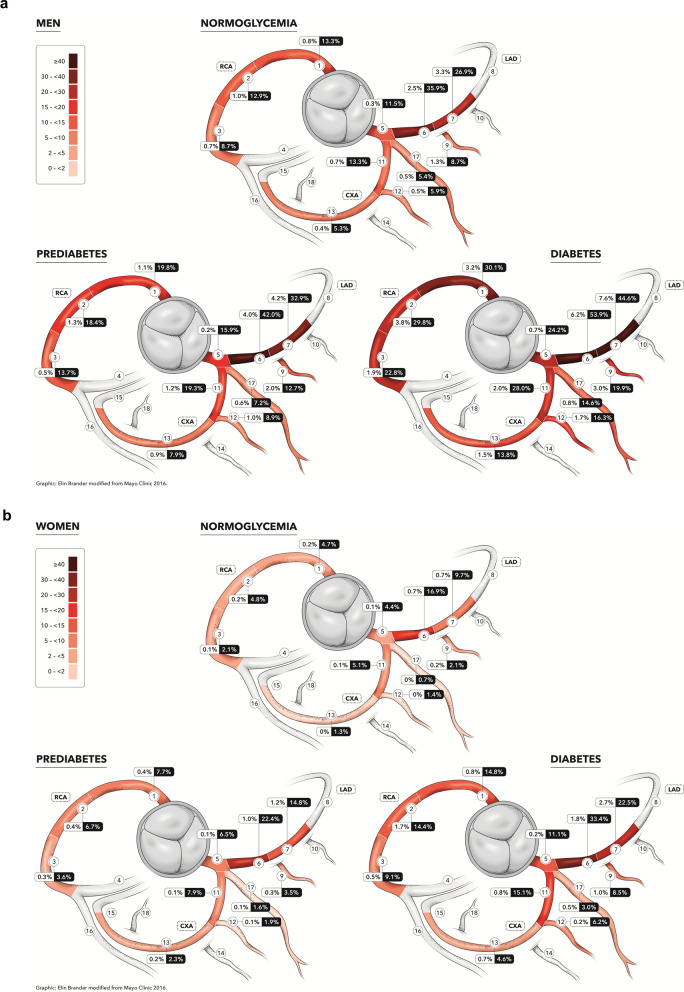
Fig. 2.
a. Distribution of CCTA-detected atherosclerosis in SCAPIS male participants according to glycaemic status. Frequency of atherosclerosis in the 11 most proximal coronary segments in men in the SCAPIS cohort. The heat map refers to frequency of any form of atherosclerosis. The number within boxes refers to the coronary stenosis status (≥ 50% /any atherosclerosis). b. Distribution of CCTA-detected atherosclerosis in SCAPIS female participants according to glycaemic status. Frequency of atherosclerosis in the 11 most proximal coronary segments in women in the SCAPIS cohort. The heat map refers to frequency of any form of atherosclerosis. The number within boxes refers to the coronary stenosis status (≥ 50%/any atherosclerosis)

