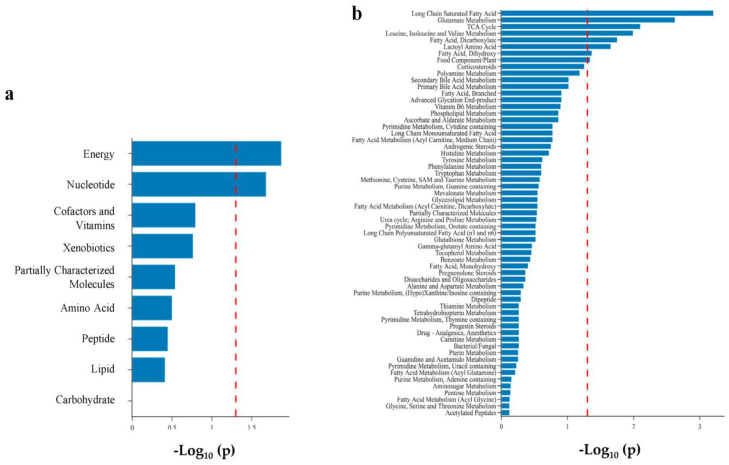
Figure 4.
Bar plot of pathway enrichment analysis of metabolomic differences between infants on TPN vs. enteral feeds. (a) superpathway; (b) subpathway. Metabolite set enrichment analysis was performed using a Fisher Exact Test on subpathways with at least two named metabolites. Eight sub-pathways were found to be enriched at p < 0.05 (dashed red line).

