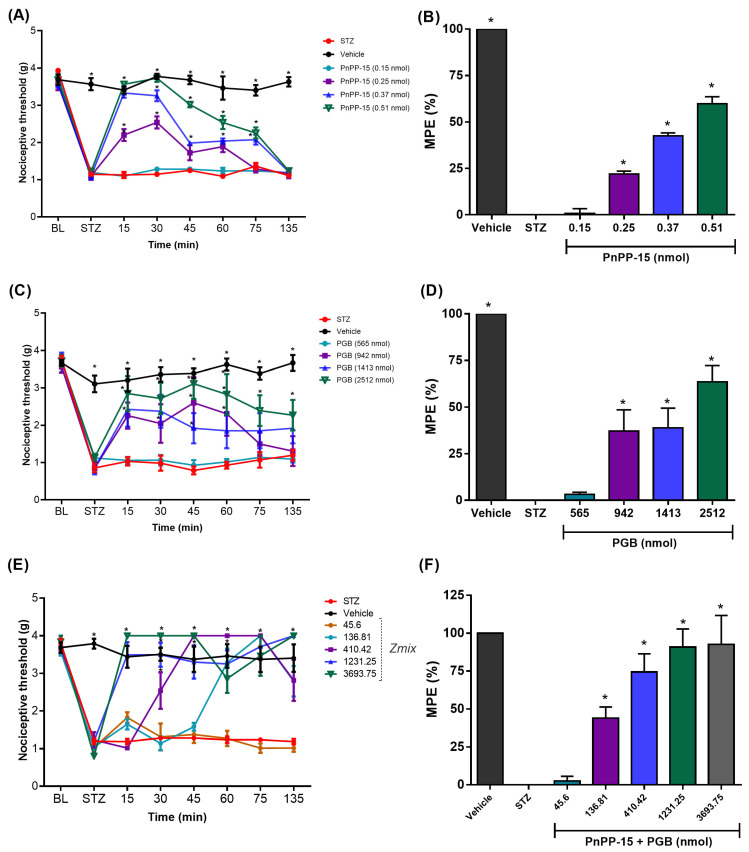
Figure 2.
Effect of PnPP-15, PGB, and their combination after intraplantar administration in different doses. The BL (Baseline) shows the threshold before STZ, mechanical allodynia can be seen on the STZ time point. Time and dose-response curve of PnPP-15 (A), PGB (C), and PnPP-15 + PGB (E). Their respective maximum possible effects (MPE) were calculated through the area under the curve, for 135 min, PnPP-15 (B), PGB (D), and PnPP-15 + PGB (F). Measurements began fifteen minutes after peptide administration and were performed every fifteen minutes. Time and dose-response curves were analyzed using two-way repeated measures ANOVA followed by Post hoc Bonferroni test. The maximum possible effect (MPE%) plot was analyzed using one-way ANOVA followed by Dunnett’s Post hoc test. Data are expressed as mean ± SEM, (n = 6 animals per group). * p < 0.05 concerning the STZ group.

