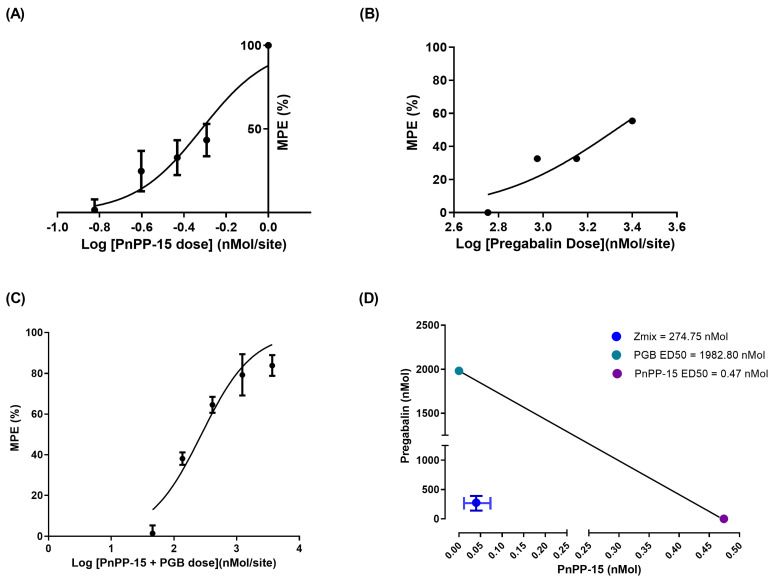
Figure 3.
Combination of PnPP-15 and PGB plotted on an isobologram. Dose-response curve of PnPP-15 (A), PGB (B), and their combination (C). The Isobologram (D) PGB ED50 (y-axis) vs. PnPP-15 (x-axis) with the theoretical additive line connecting the ED50 values. The point inside the graph represents the ED50 experimentally obtained ED50, Zmix (with 95% confidence intervals) indicating a synergistic interaction.

