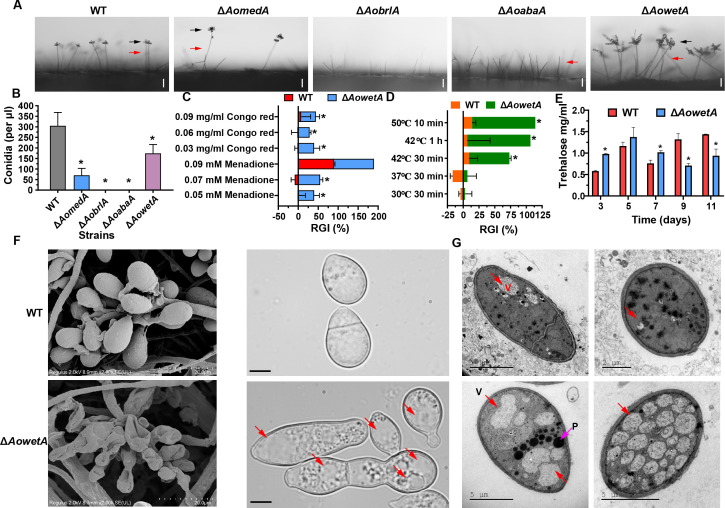
Fig 1.
Comparison of conidiophores and conidia between WT and mutant strains. (A) Conidiophores and conidia of WT and mutant strains were observed under a light microscope. Bar = 10 µm. Red arrows indicate conidiophores, and black arrows indicate conidia. (B) Comparison of conidia yields. (C) Stress tolerance of conidia of WT and ΔAowetA mutant strains to chemical reagents. (D) Stress tolerance of conidia of WT and ΔAowetA mutant strains to heat shock. (E) Comparison of trehalose content. (F) Observation of conidiophores and conidia of WT and ΔAowetA mutant strains using a scanning electron microscope (SEM). Red arrows indicated vacuole. (G) Observation of ultrastructure of conidia of WT and ΔAowetA mutant strains under a transmission electron microscope. Red arrows indicate vacuoles and pink arrow indicates peroxisome-like structures. Asterisk (B–E) indicates a significant difference between mutant and WT strain (Tukey’s HSD, P < 0.05).

