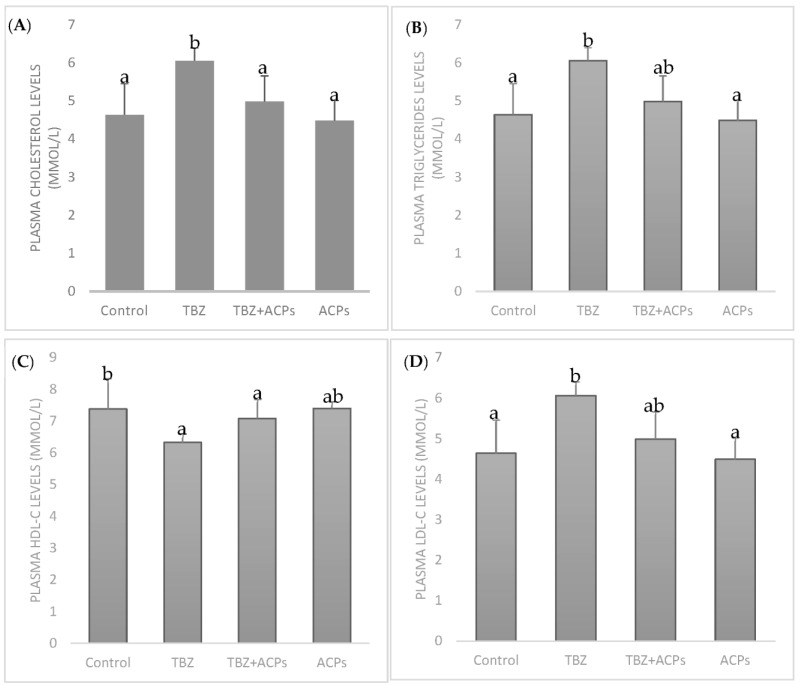
Figure 8.
Effects of ACPs on plasma lipid profile. (A) Total cholesterol levels, (B) triglyceride levels, (C) HDL-C levels, and (D) LDL-C levels. Results are expressed as the means of three experiments ± SD. The number of determinations was n = 3. a,b In the same column indicate significant differences (p < 0.05).

