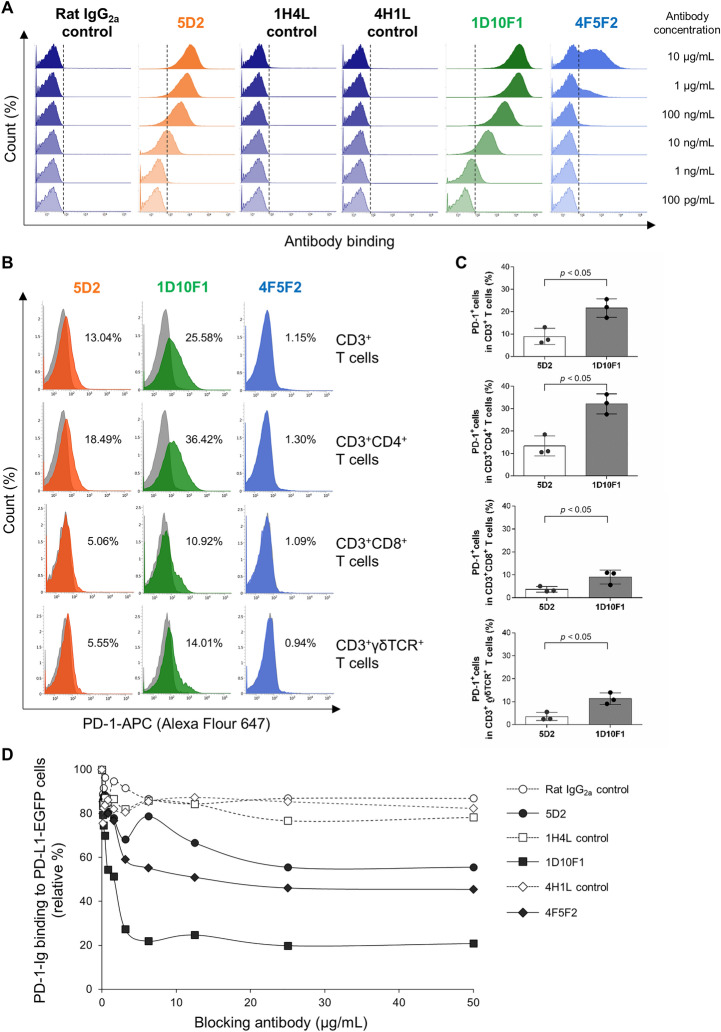
Figure 1.
Generation and characterization of anti-bovine PD-1 rabbit mAbs. A Flow cytometric analysis using anti-bovine PD-1 rabbit mAbs (1D10F1 and 4F5F2) and anti-bovine PD-1 rat mAb (5D2). BoPD-1-myc cells were stained with the mAbs using serial dilutions (10 μg/mL to 100 pg/mL). Rat IgG2a isotype control and rabbit IgG controls (1H4L and 4H1L) were used as negative controls. B, C Flow cytometric analysis of PD-1 expression in T-cell subsets of cattle (n = 3). Freshly isolated bovine PBMCs were stained with anti-bovine PD-1 rabbit mAbs (1D10F1 and 4F5F2) and anti-bovine PD-1 rat mAb (5D2). Rat IgG2a isotype control and rabbit IgG control (1H4L) were used as negative controls. B Representative histograms of staining with anti-PD-1 mAbs (orange, green, or blue histograms) and matched negative controls (gray histograms) are shown. The gating strategy of this assay was provided as Additional file 3. C Percentages of PD-1+ cells in each T-cell subset in leukocytes from healthy cattle (n = 3). Bars indicate the group mean percentage. Significant differences between each of the two groups were determined using a Student’s t test. *p < 0.05. D BoPD-1-Ig was preincubated with anti-bovine PD-1 rabbit mAbs (1D10F1 and 4F5F2) and anti-bovine PD-1 rat mAb (5D2), and then reacted with BoPD-L1-EGFP cells. BoPD-1-Ig bindings were evaluated by flow cytometry. Rat IgG2a and rabbit IgG controls (1H4L and 4H1L) were used as negative controls. Each curve represents the relative binding of BoPD-1-Ig preincubated with each antibody compared with the no-antibody control.

