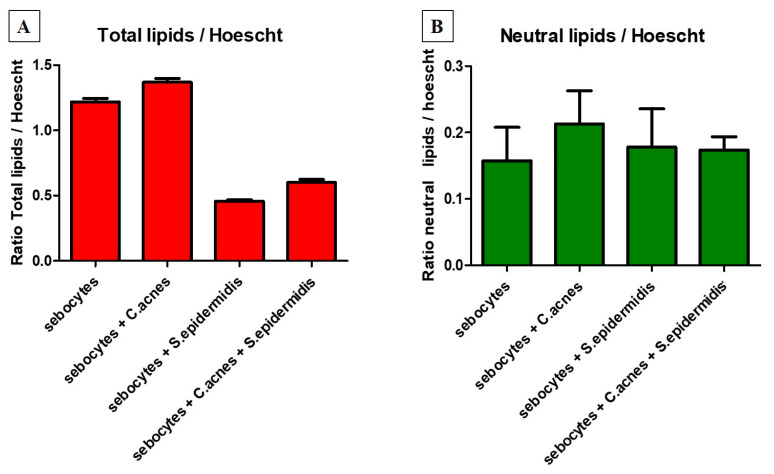
Figure 5.
Comparison between fluorescence intensity ratios of Nile Red and Hoechst signals obtained using excitation and emission wavelengths of 520 and 625 nm for total lipids Panel (A) and 475 and 530 nm for neutral lipids Panel (B), as well as 356 and 465 nm for nuclei. CA: C. acnes; SE: S. epidermidis. Statistical analysis via One-way ANOVA and Dunnett’s Multiple Comparison Test (95% confidence interval; alpha = 0.05%) for Total Lipids showed p values of 0.0045 for sebocytes compared to sebocytes with added C. acnes, as well as 0.001 for sebocytes compared to adding S. epidermidis and S. epidermidis combined with C. acnes. No statistical differences were found for the Neutral Lipids.

