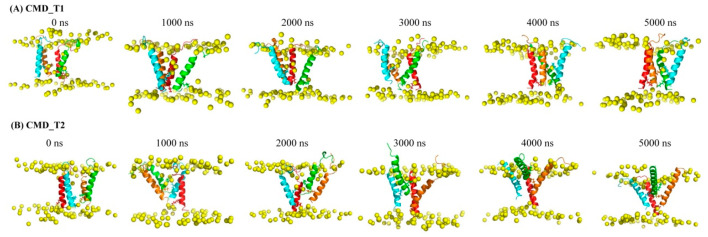
Figure 1.
Snapshots of the tetrameric AapA1-28 protein–-membrane structure at various time points in (A) CMD_T1 simulation and (B) CMD_T2 simulation. The AapA1-28 proteins are represented by cartoons in different colors: red, green, orange, and cyan. The molecular dynamics (MD) simulation highlights the side chain orientation of the K-23 residue, which undergoes a transition from the lower membrane to the upper membrane. The K-23 residues are depicted as sticks. The phosphorus atoms of the lipid bilayer depicted in yellow ball.

