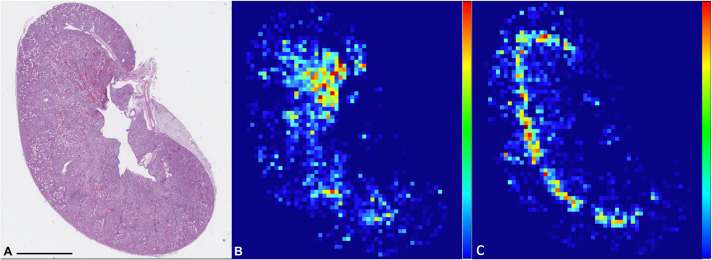
Fig. 3.
PAS stained WSI of mouse kidney (A) and heatmaps of ‘Intratubular casts’ (B) and ‘Tubular necrosis’ (C). Percentage of area of each patch (512×512 pixels) occupied by pathological classes is represented as colours ranging from deep blue (0%) to red (100%) in order to spatially visualise the pathological classes within kidney parenchyma. Scale bars: 2 mm.

