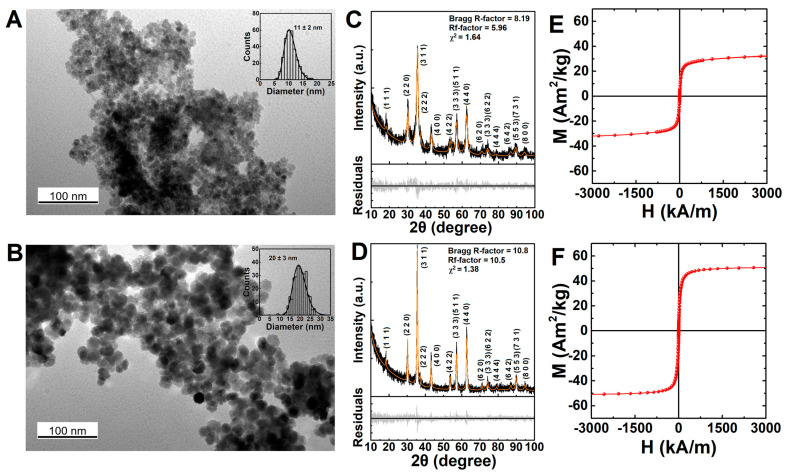
Figure 1.
TEM images of the (A) MnFe2O4 nanoparticles and (B) Fe3O4 nanoparticles. Inset: Histograms of the particle sizes measured in the respective samples. XRD diffraction pattern and fitted Rietveld refinement pattern of the (C) MnFe2O4 and (D) Fe3O4 nanoparticles. Magnetization dependence on the applied magnetic field measured at 300 K for (E) MnFe2O4 nanoparticles and (F) Fe3O4 nanoparticles.

