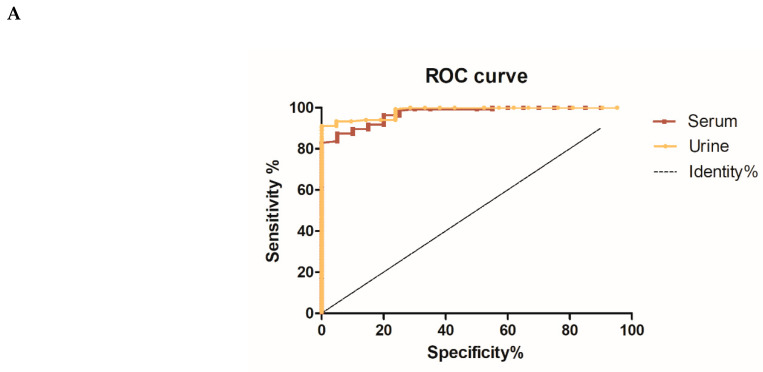
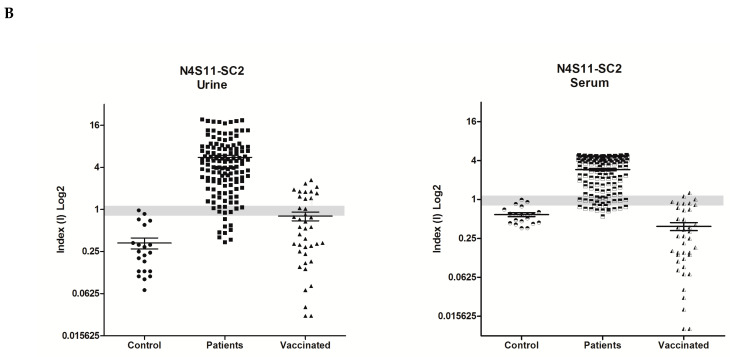
Figure 3.
Comparative diagnostic performance of N4S11-SC2 protein with urine and serum samples. (A) Receiver Operating Characteristic (ROC) curves were constructed using the individual index (I) value for each sample to obtain sensitivity, specificity and area under the curve values. (B) ELISA assays were done using urine and paired serum samples (n = 135) from COVID-19 patients with previously positive qRT-PCR. Urine and paired serum samples (n = 40) were analyzed from previously vaccinated subjects. Urine and unpaired serum samples from healthy control subjects (n = 21 and n = 20, respectively) were also used. The mean of each group is shown and the gray band indicates indeterminate values for each sample, while index values below the range (<0.8) are negative and values above (>1.1) are considered positive.


