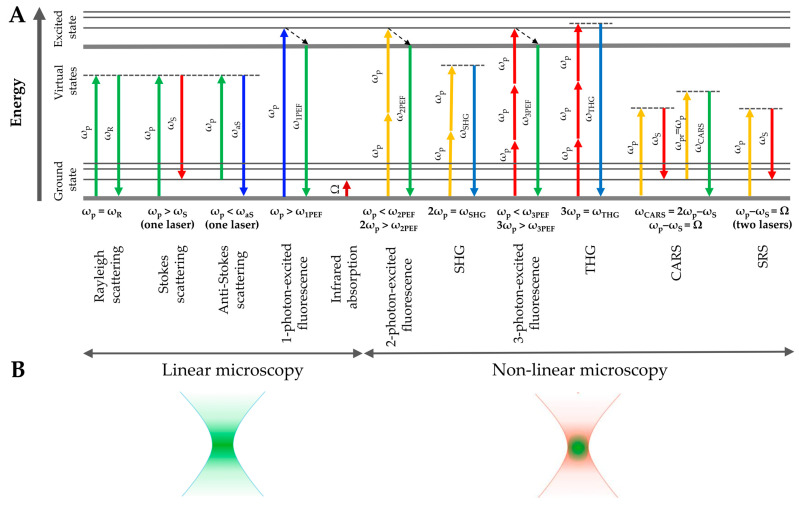
Figure 4.
Jablonski diagram of linear and non-linear optical processes (A) and spatial localization of the signal with linear (the signal is generated in the entire volume) and non-linear (the signal is generated only in a small femtoliter volume) excitation. The distribution of light energy is shown in the green color gradient (B). The colors of the arrows in (A) indicate the shift (increase or decrease) of the emission wavelength in relation to the excitation wavelength (for a single process). The figures are adopted with permission from Ref. [76].

