Figure 7.
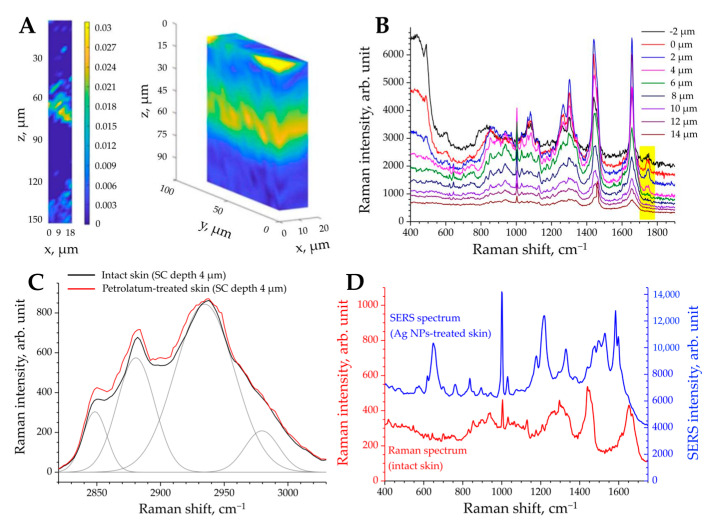
Representative CRM images and Raman spectra of treated skin. (A): 2D (left) and 3D (right) penetration depth profiles of hyaluronic acid (10 kDa) into porcine skin ex vivo, adopted under CC BY-NC-ND 4.0 license from Ref. [218]; (B): 1D z-stack point measurement (depth profile) Raman spectra of SC of jojoba oil-treated skin (yellow highlighted area indicates presence of jojoba oil—specific band at 1740 cm−1); (C): HWN Raman spectra of SC (depth 4 µm) of intact (black) and petrolatum-treated (red) skin (the spectrum of intact skin is decomposed using four lines described with Gaussian functions—shown in grey); (D): The typical SERS spectrum of skin treated with silver nanoparticles (blue, depth 4 µm, SC) compared to the spontaneous Raman spectrum of intact porcine skin ex vivo (red, depth 4 µm, SC), adopted under CC BY 2.0 license from Ref. [223].

