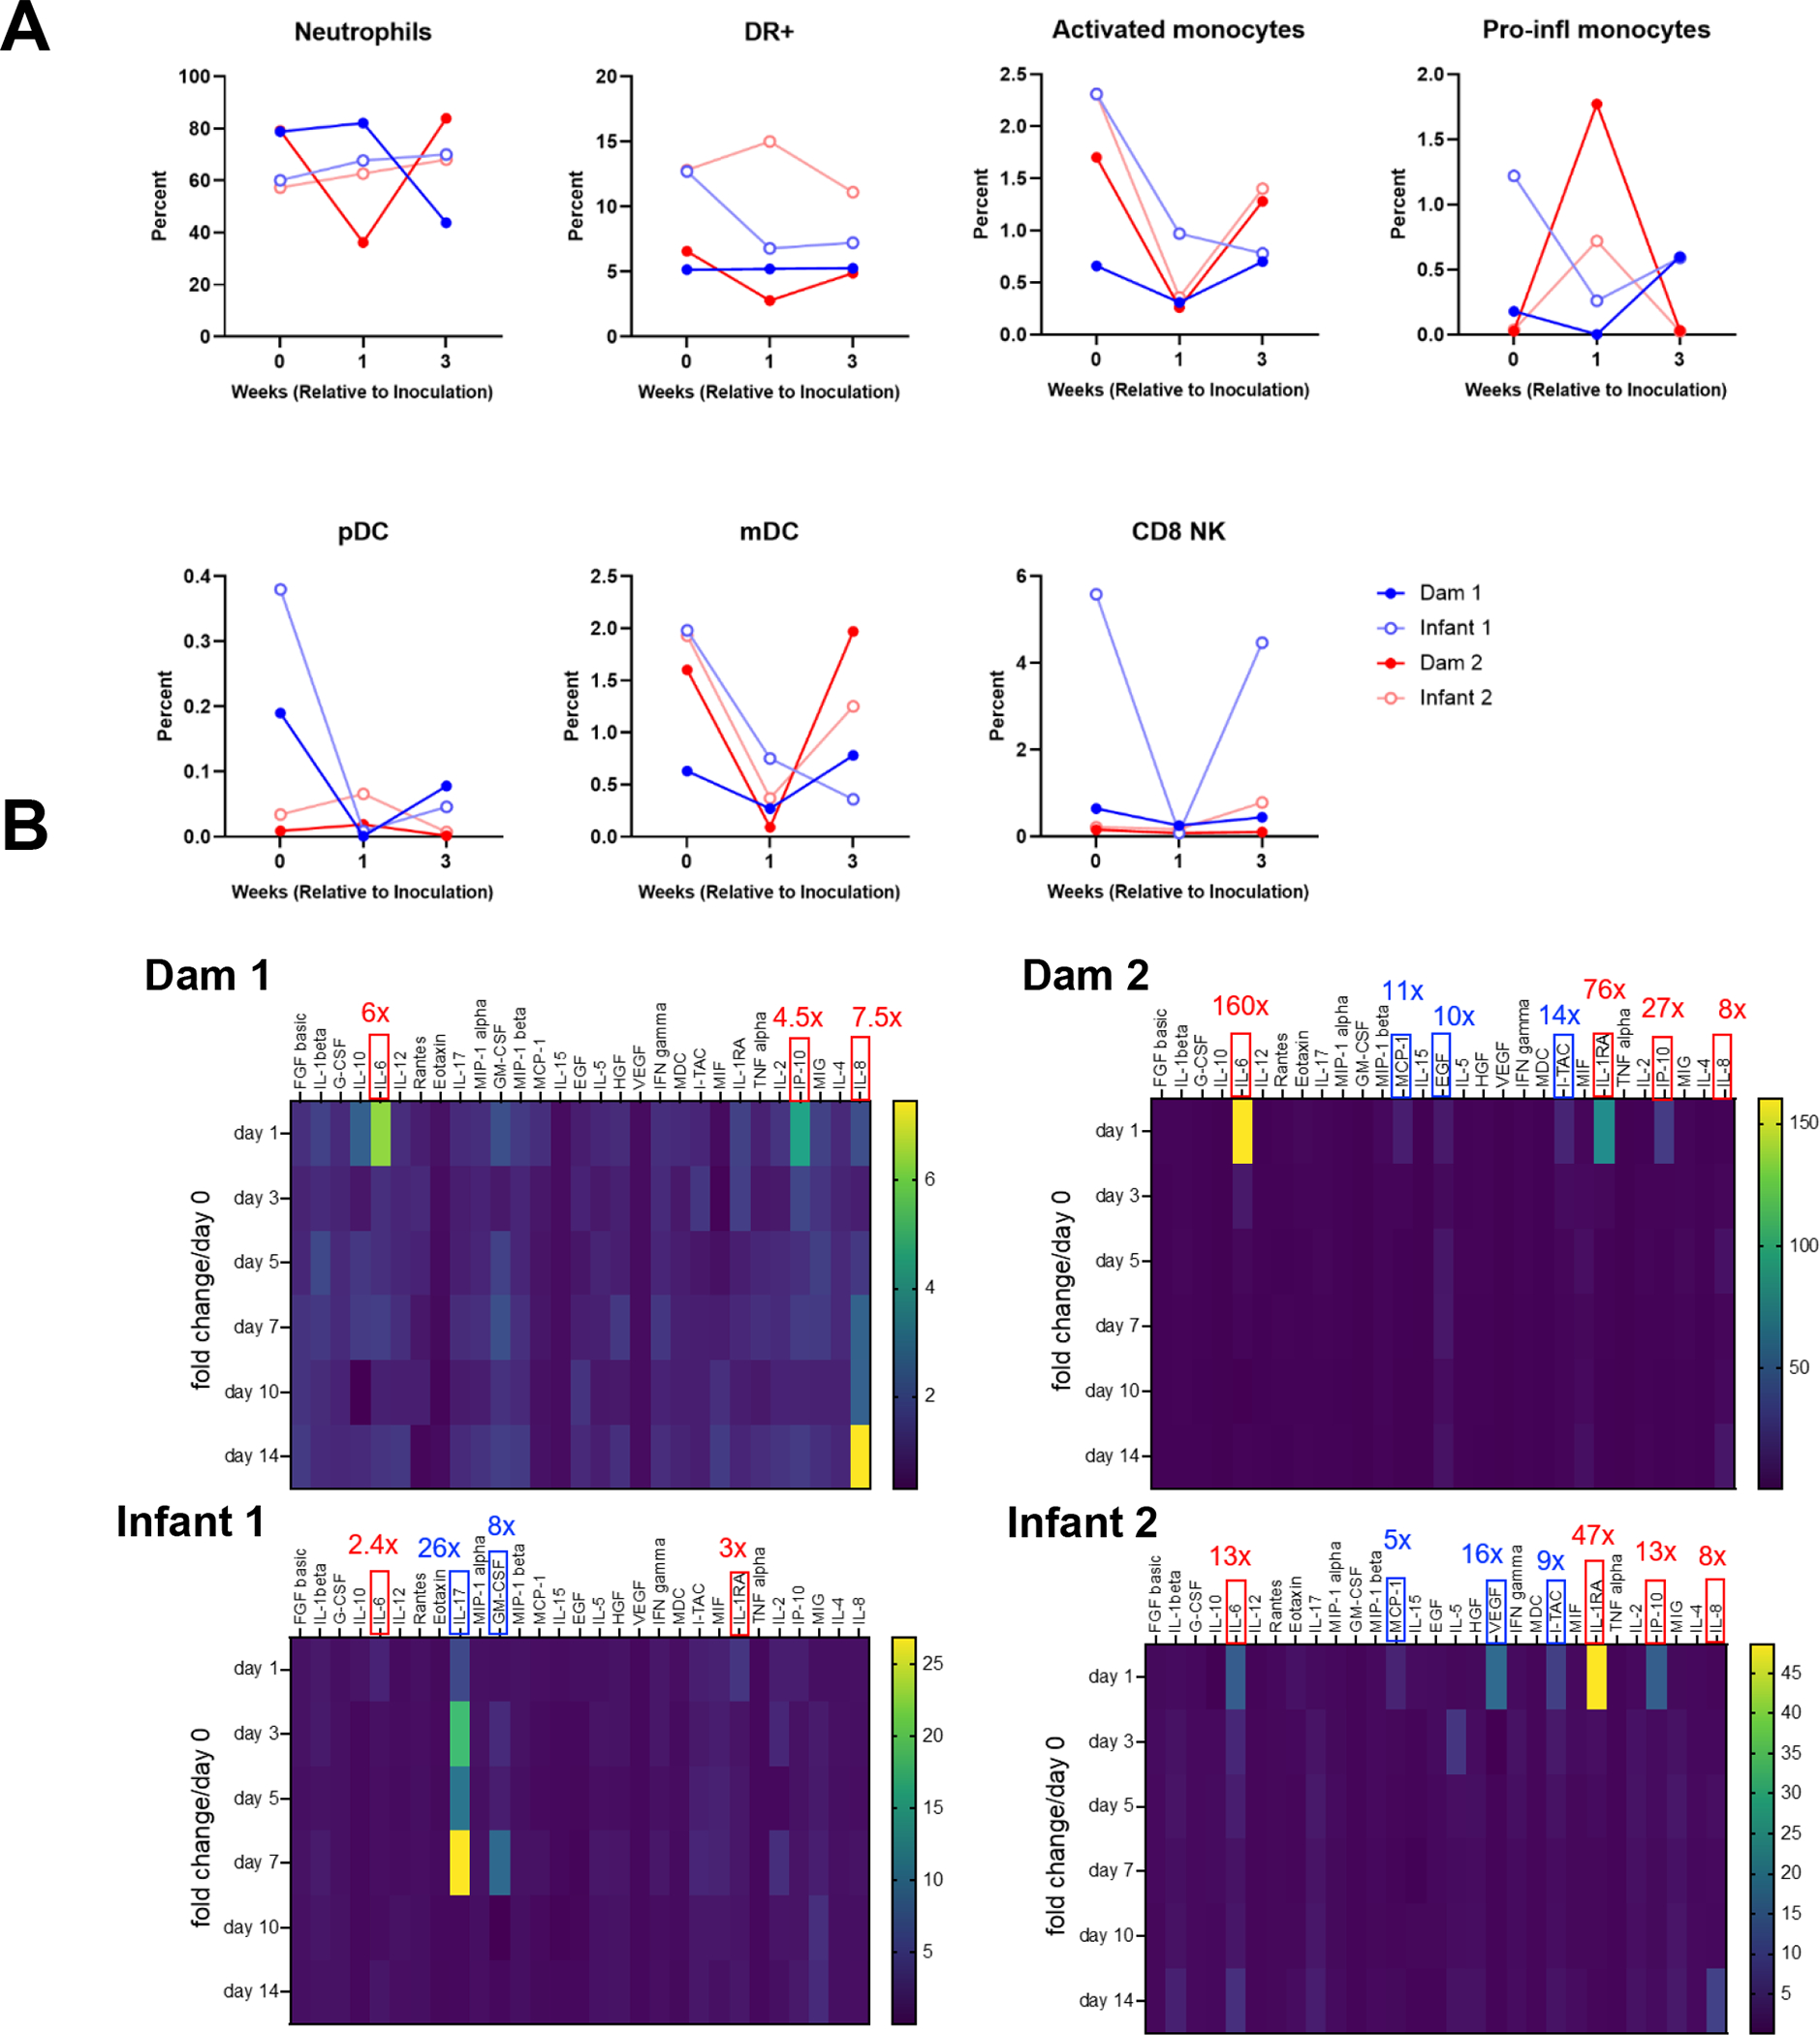
FIG 2.

Circulating innate immune cell and cytokine responses in SARS-CoV-2-infected dam and infant rhesus macaques (A) Kinetics of innate immune cell responses including neutrophils, total HLA-DR+ (lineage-, CD66-) cells, activated monocytes, pro-inflammatory monocytes, plasmacytoid dendritic cells (pDC), myeloid dendritic cells (mDC) and CD8+ natural killer (NK) cells. (B) Heat maps of innate cytokines for each animal represented as fold change over day 0 post SARS-CoV-2 infection. Notable increases in key cytokines observed in all animals are denoted in red box, while increase in key cytokines observed in individual animals are denoted in blue box (values represent peak fold change over day 0). The scale to the right of the heat map is in pg/ml.
