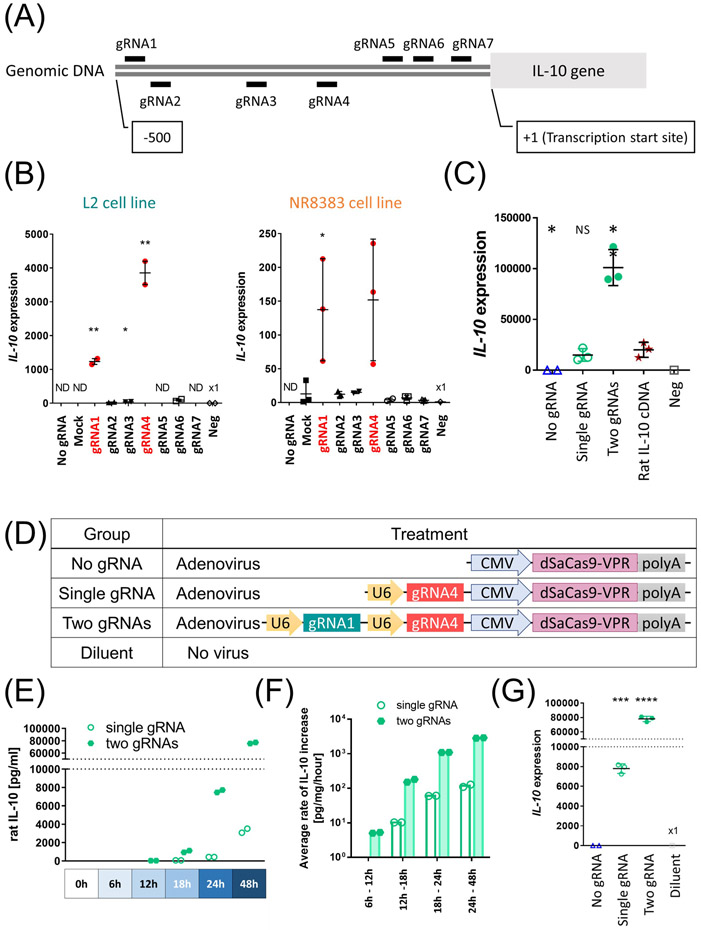
Figure 1.
Transcriptional activation of the endogenous IL-10 using dSaCas9-VPR in rat lung cell lines. (A) The design of gRNAs. The short lines indicate the genomic loci targeted by each gRNA (gRNA1 to gRNA7). (B) Each gRNA was expressed along with dSaCas9 by co-transfection of two plasmids in either L2 cells (n=2, independent transfections) or NR8383 cells (n=3, independent transfections). IL-10 expression was measured after 48 hours by qPCR. Mean (SD) are shown. Negative control (Neg) received transfection reagent without any plasmids. Ct values were normalized to a housekeeping gene peptidylprolyl isomerase A (PPIA). Values detected after 40 cycles were shown as fold expression to Neg. Mock represents effects of non-targeting gRNA. Student’s t-test was applied to compare each group with negative control (L2 cells) or Mock group (NR8383 cells). (C) L2 cells were transfected with a single plasmid or co-transfected with two plasmids (equimolar quantity) and assessed for IL-10 gene expression after 48h (n=3 independent transfections). Each group was compared with the rat IL-10 cDNA group (Rat IL-10 ORF) using Student’s t-test. (D) Experimental groups used for in vitro assessment. (E, F) L2 cells were transduced with adenoviral vector at multiplicity of infection (MOI) of 250 (n=2, independent transductions). (E) IL-10 protein concentration of the cell culture supernatants was measured by ELISA at different time points. The undetected values were set as 0, which was a back-calculated concentration of the sample with the lowest OD. (F) Calculated average rates of IL-10 protein increase. Values above detection limits were used for calculation. (G) IL-10 transcript levels 48h after adenoviral transduction measured by qPCR (n=3, independent transductions). Student’s t-test was used to compare with no gRNA group. ND; not detectable, NS; not significant, *: p ≤ 0.05, **: p ≤ 0.01, ***: p ≤ 0.001, ****: p ≤ 0.0001.

