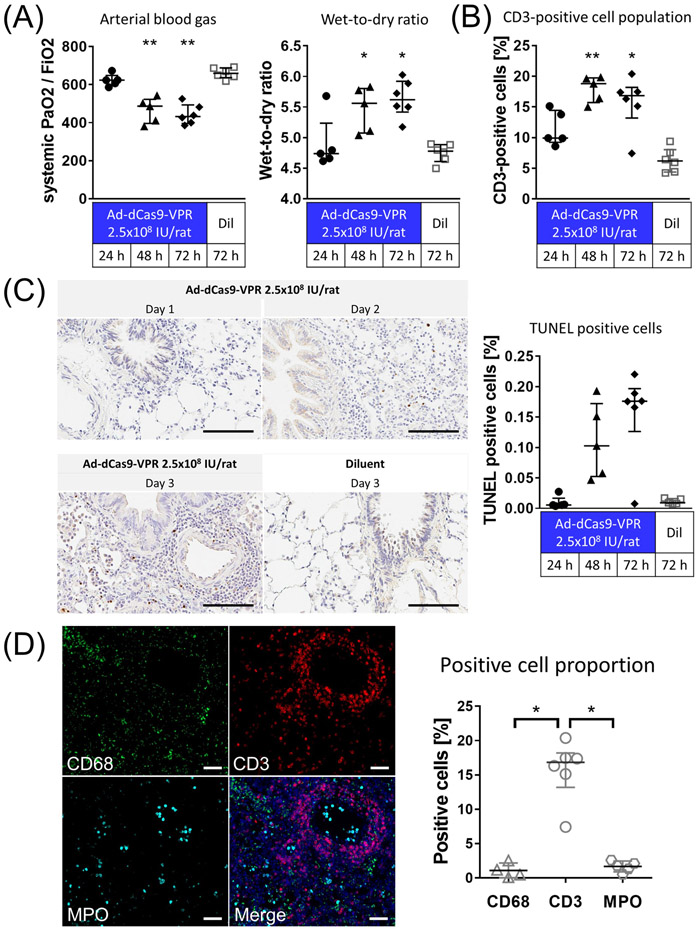
Figure 2.
Assessment of inflammation evoked by trans-airway delivery of higher-dose Ad-dSaCas9-VPR in the lung. (A) Ad-dSaCas9-VPR was administered to the left lung via the airways at a dose of 2.5x10⁸ infectious unit (IU)/rat or diluent buffer alone (Ad-dCas9-VPR at 24h and 48h, n=5; others, n=6). PaO2 was analyzed using arterial blood drawn from the abdominal aorta after 5 min ventilation at FiO2 of 1.0. Wet-to-Dry ratio of the lung was calculated by weighing the lung tissue before and after incubation in the oven at 85 °C. Median (interquartile range) were presented. Symbols indicate *: p ≤ 0.05 and **: p ≤ 0.01 (Kruskal-Wallis followed by Dunn’s correction compared to the diluent group). (B) CD3-positive cell population in immunohistochemistry were measured using the Cytonuclear IHC algorithm in HALO image analysis platform. Median (interquartile range) were presented. Symbols indicate *: p ≤ 0.05 and **: p ≤ 0.01 (Kruskal-Wallis followed by Dunn’s correction compared to the diluent group). (C) TUNEL staining of lung tissues fixed at 1-3 days after adenoviral vector delivery. Scale bars, 100 μm. The percentage of cells that are strongly positive for TUNEL staining was quantified using the Cytonuclear IHC algorithm in HALO image analysis platform (n=6 for Ad-dCas9-VPR on day 3, n=5 for other groups). Median (interquartile range) are presented. (C) Immunofluorescence of lung tissue fixed 3 days after Ad-dSaCas9-VPR delivery. MPO; myeloperoxidase. Scale bars, 50 μm. The proportion of cells positive for each marker was analyzed using the Cytonuclear IHC algorithm in HALO image analysis platform. Median (interquartile range) were presented. Symbols indicate *: p ≤ 0.05 (Kruskal-Wallis followed by Dunn’s correction).

