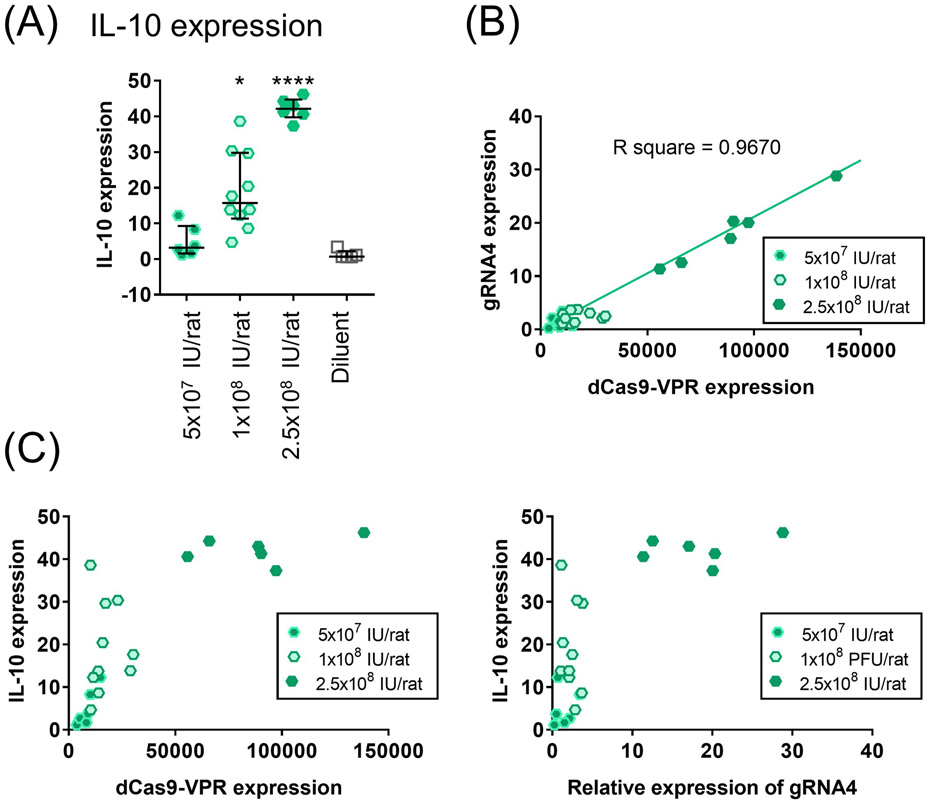
Figure 4.
Dose-effect relationship of adenoviral vector-mediated expression of dSaCas9-VPR and two gRNAs in the lung. (A) IL-10 expression in the lungs treated with two gRNAs virus after 3 days. Lower-, medium- and higher-dose represent 5x10⁷, 1x10⁸ and 2.5x10⁸ IU/rat of adenoviral vector (lower- and higher-, n=6; medium-, n=10; diluent, n=5). Median (interquartile range) are shown. A Kruskal-Wallis test followed by Dunn’s correction was used for comparison. Symbols indicate *: p ≤ 0.05, and ****: p ≤ 0.0001. (B, C) Scatter plots present the relationships between gRNA4, dSaCas9-VPR and IL-10 expression at day 3. The same cases as in A were presented. The best-fit line and R square value from a simple linear regression were computed using GraphPad software and are shown on the graph.

