
Figure 5.
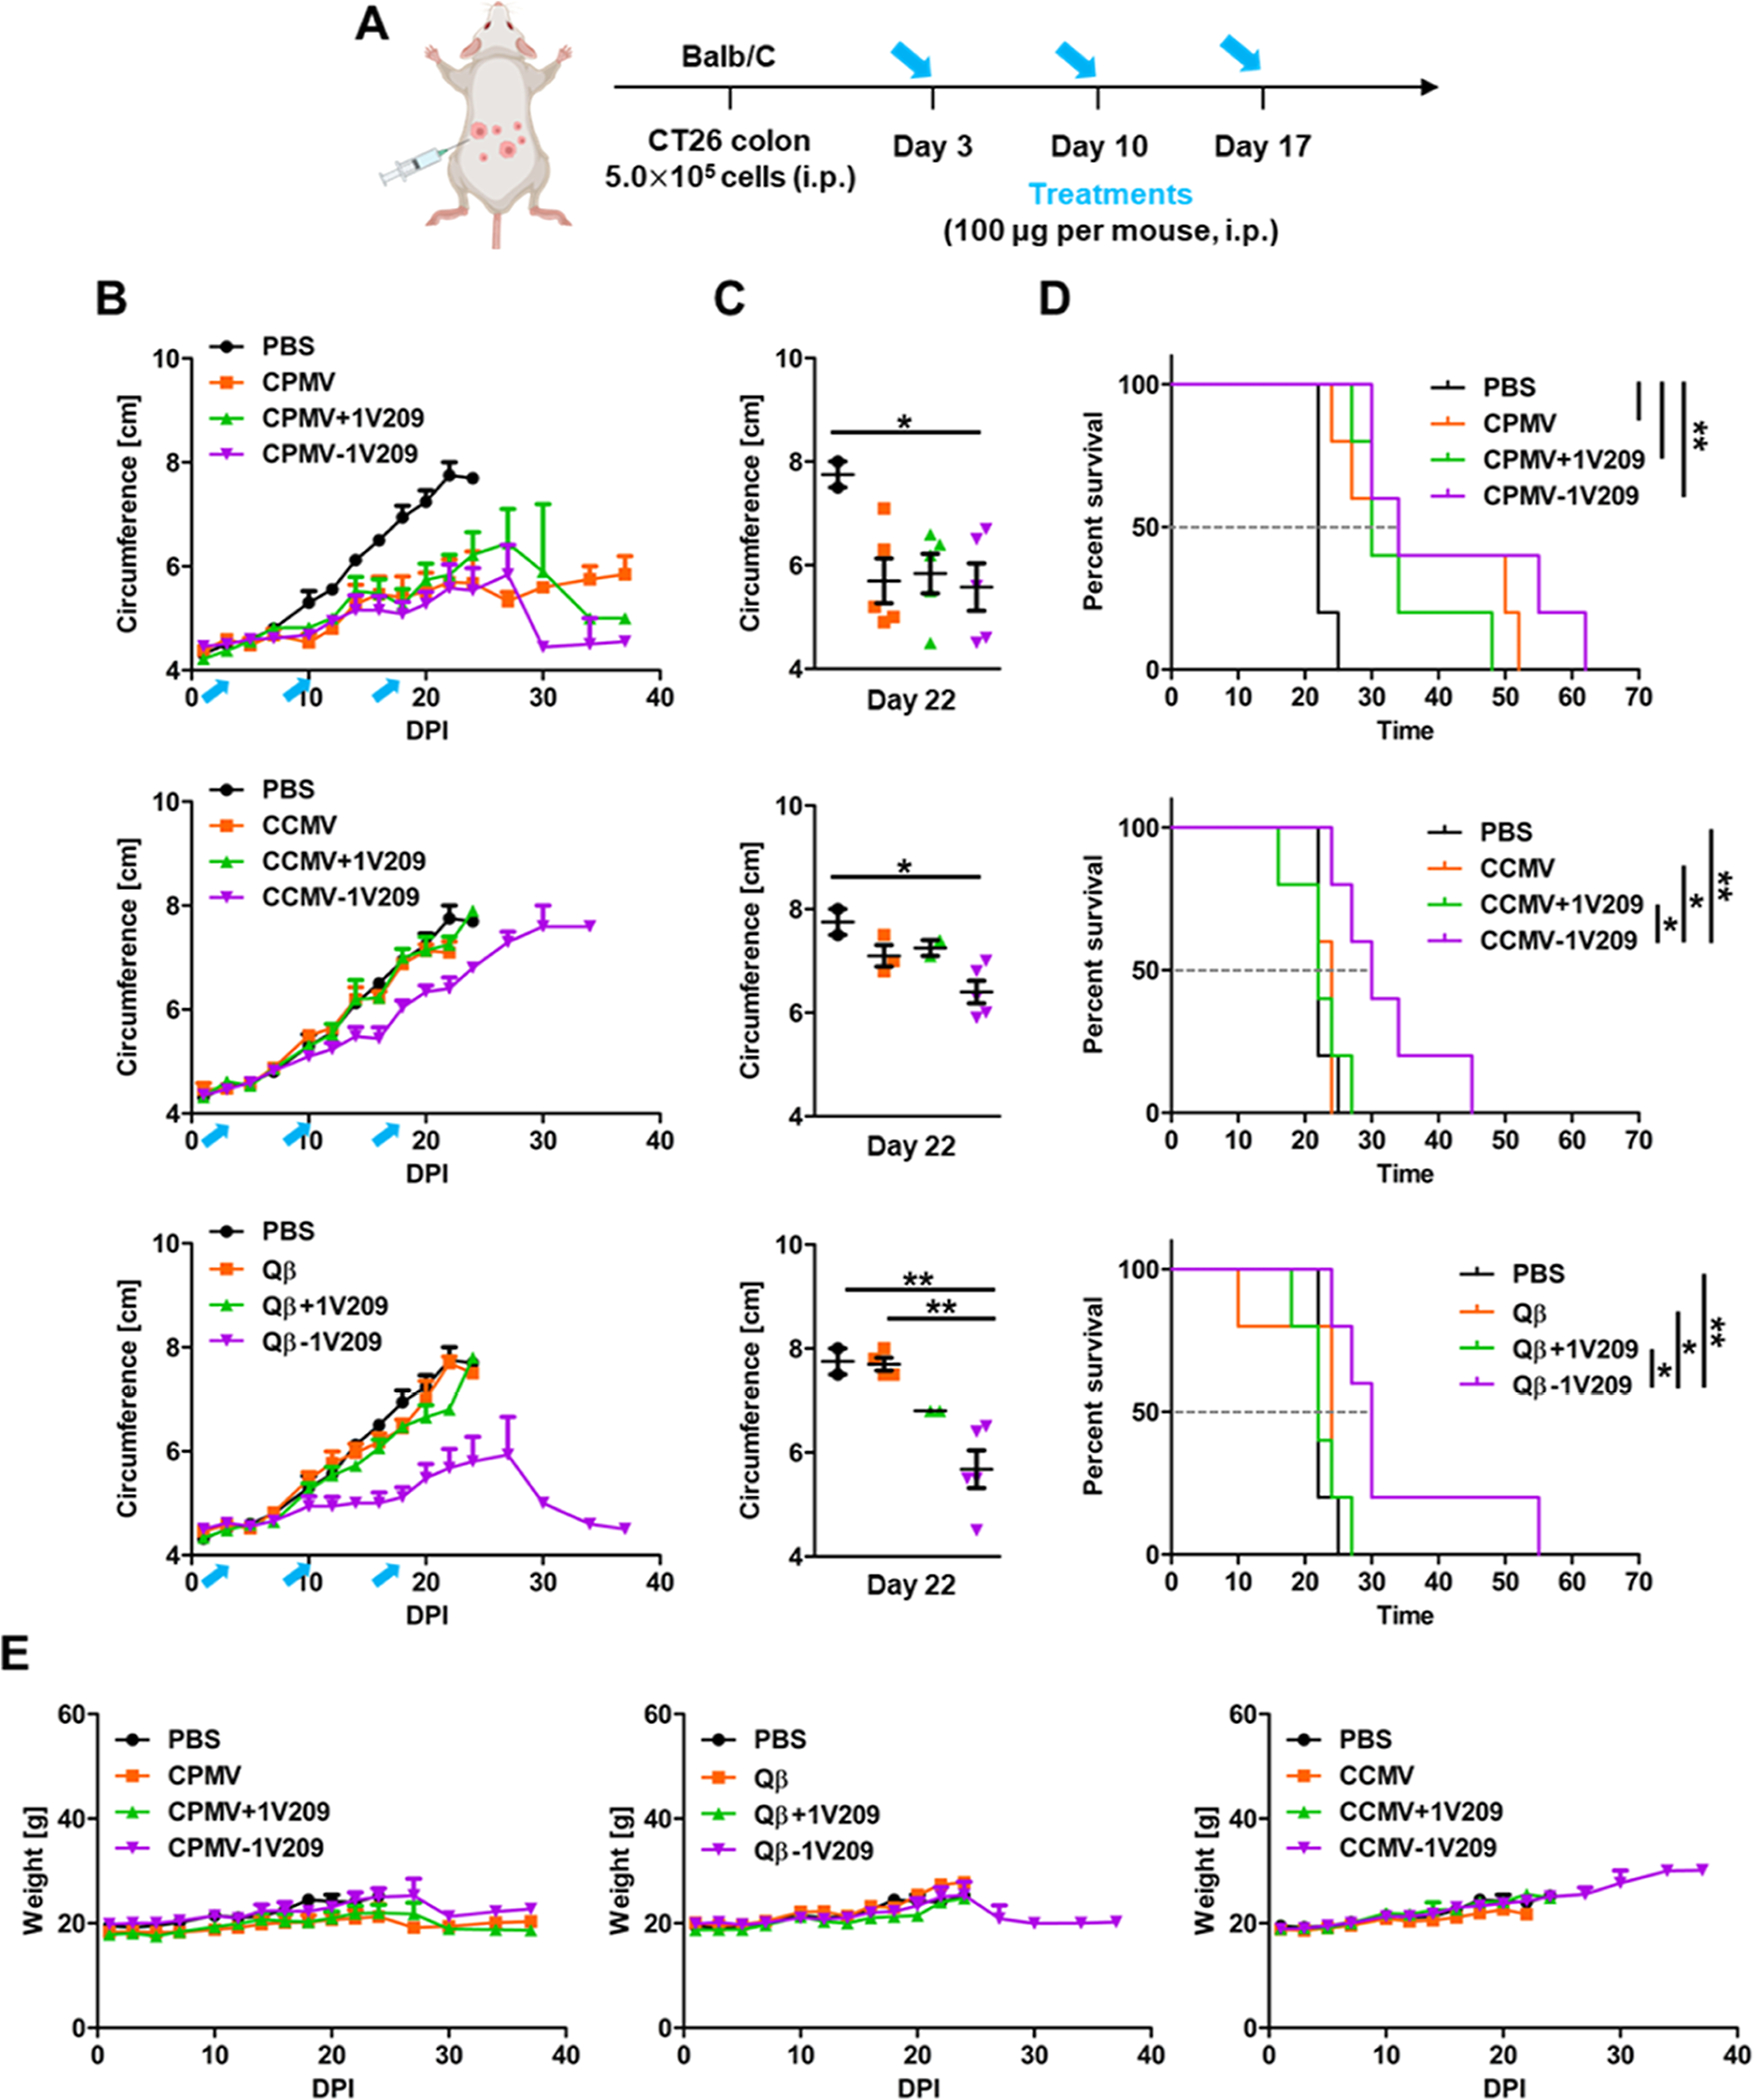
Therapeutic effects of CPMV-1V209, CCMV-1V209, and Qβ-1V209 particles in the in vivo CT26 colon cancer model. (A) Timeline of CT26 cell inoculation and treatment. (B) Tumor growth curves. Blue arrows indicate the treatment days. (C) Volumetric scatter plot of individual tumors on day 22. Data are means ± SEM (n = 5). The results were compared by one-way ANOVA with Tukey’s multiple comparisons test (**P < 0.01 and *P < 0.05). (D) Survival rates of tumor-bearing mice over 70 days (dashed line shows the intersection with median survival for each treatment). The results were compared using the log-rank (Mantel–Cox) test (**P < 0.01 and *P < 0.05). (E) Relative body weight of tumor-bearing mice over 40 days.