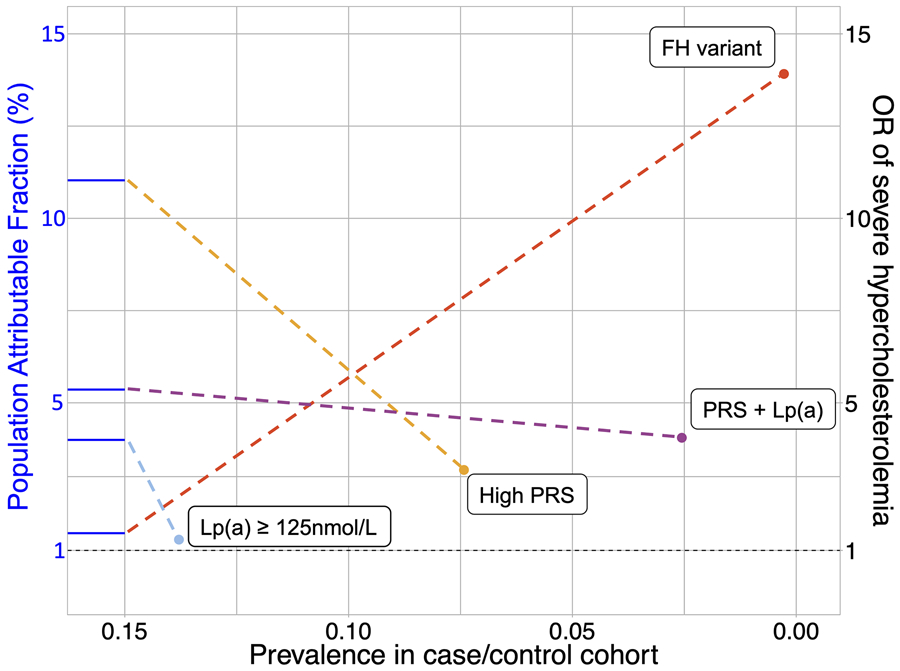
Figure 2.
Genetic determinants of severe hypercholesterolemia. A fan plot shows prevalence, odds ratio, and population attributable fraction for each determinant of severe hypercholesterolemia. The x and y coordinates of each point indicate the prevalence and odds ratio (OR), respectively, of each determinant. The population attributable fraction is represented by the y-axis intercept of the blue line connected to each point. The dashed horizontal black line demarcates an odds ratio of 1.

