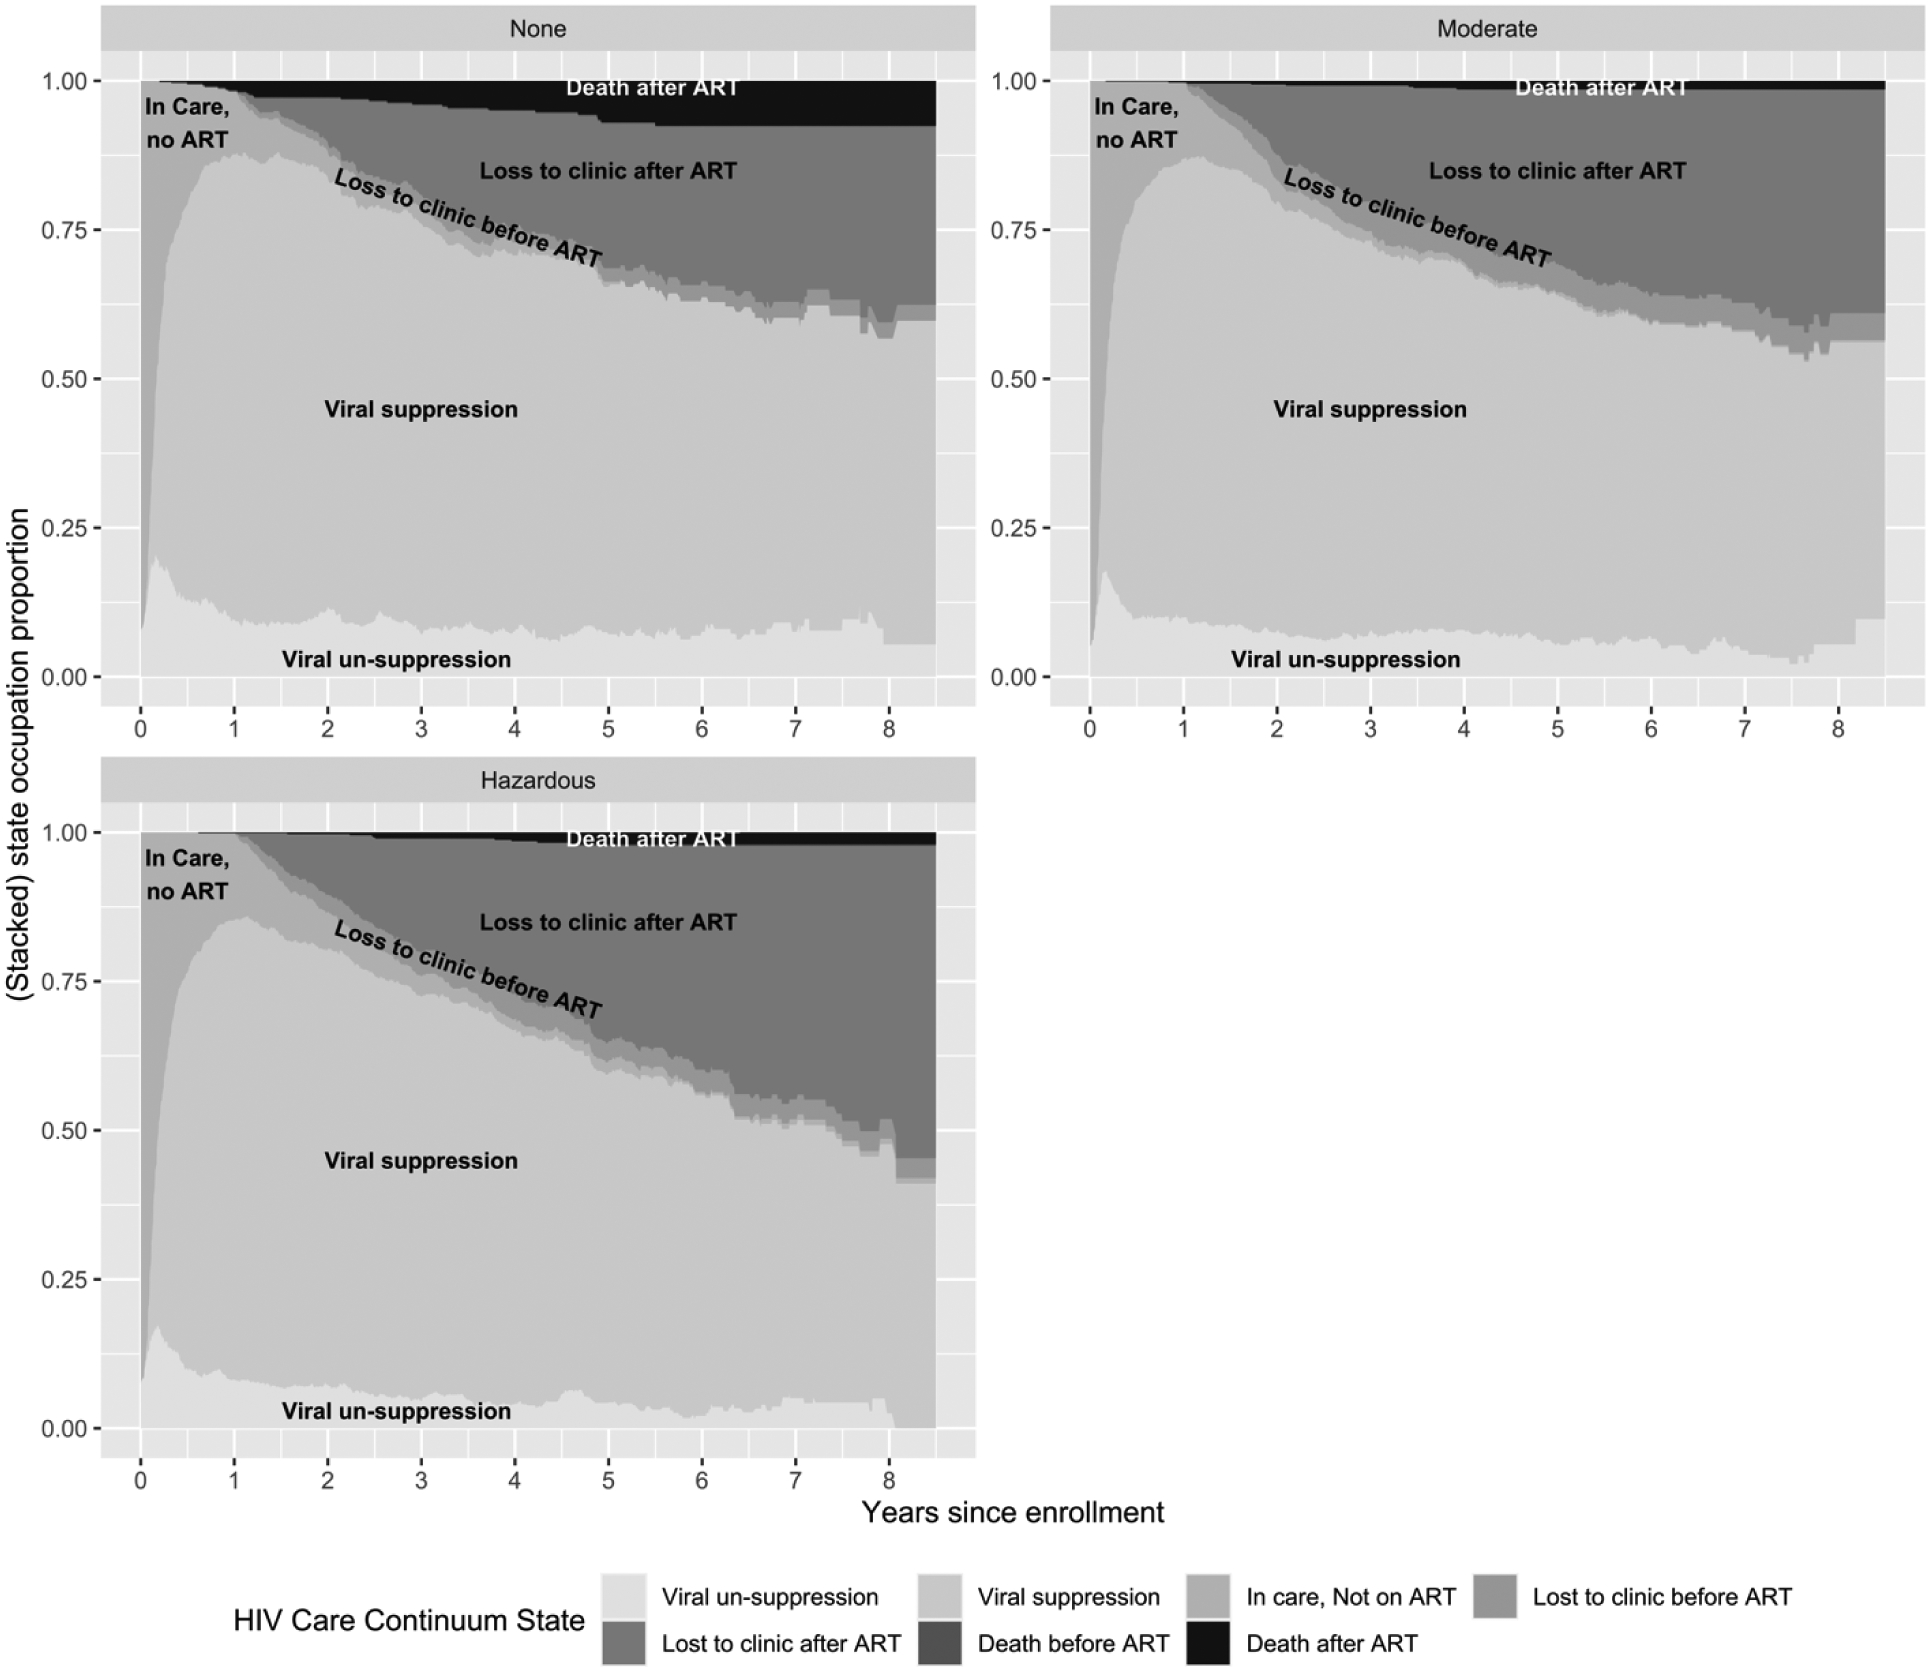
Figure 2.

State occupation probabilities (proportion of the sample estimated to be in each HIV care continuum state) over 8.5 years of follow-up stratified by baseline alcohol use among 1781 antiretroviral therapy-naïve persons who enrolled in the Center for AIDS Clinical Research Network of Integrated Clinical Systems, 2011–2019, and who self-reported alcohol consumption within 1 year of enrollment
a Note that while the proportion of the cohort that experiences “Death before ART” is plotted in these figures, it is so small that is is not visible on the graphs
