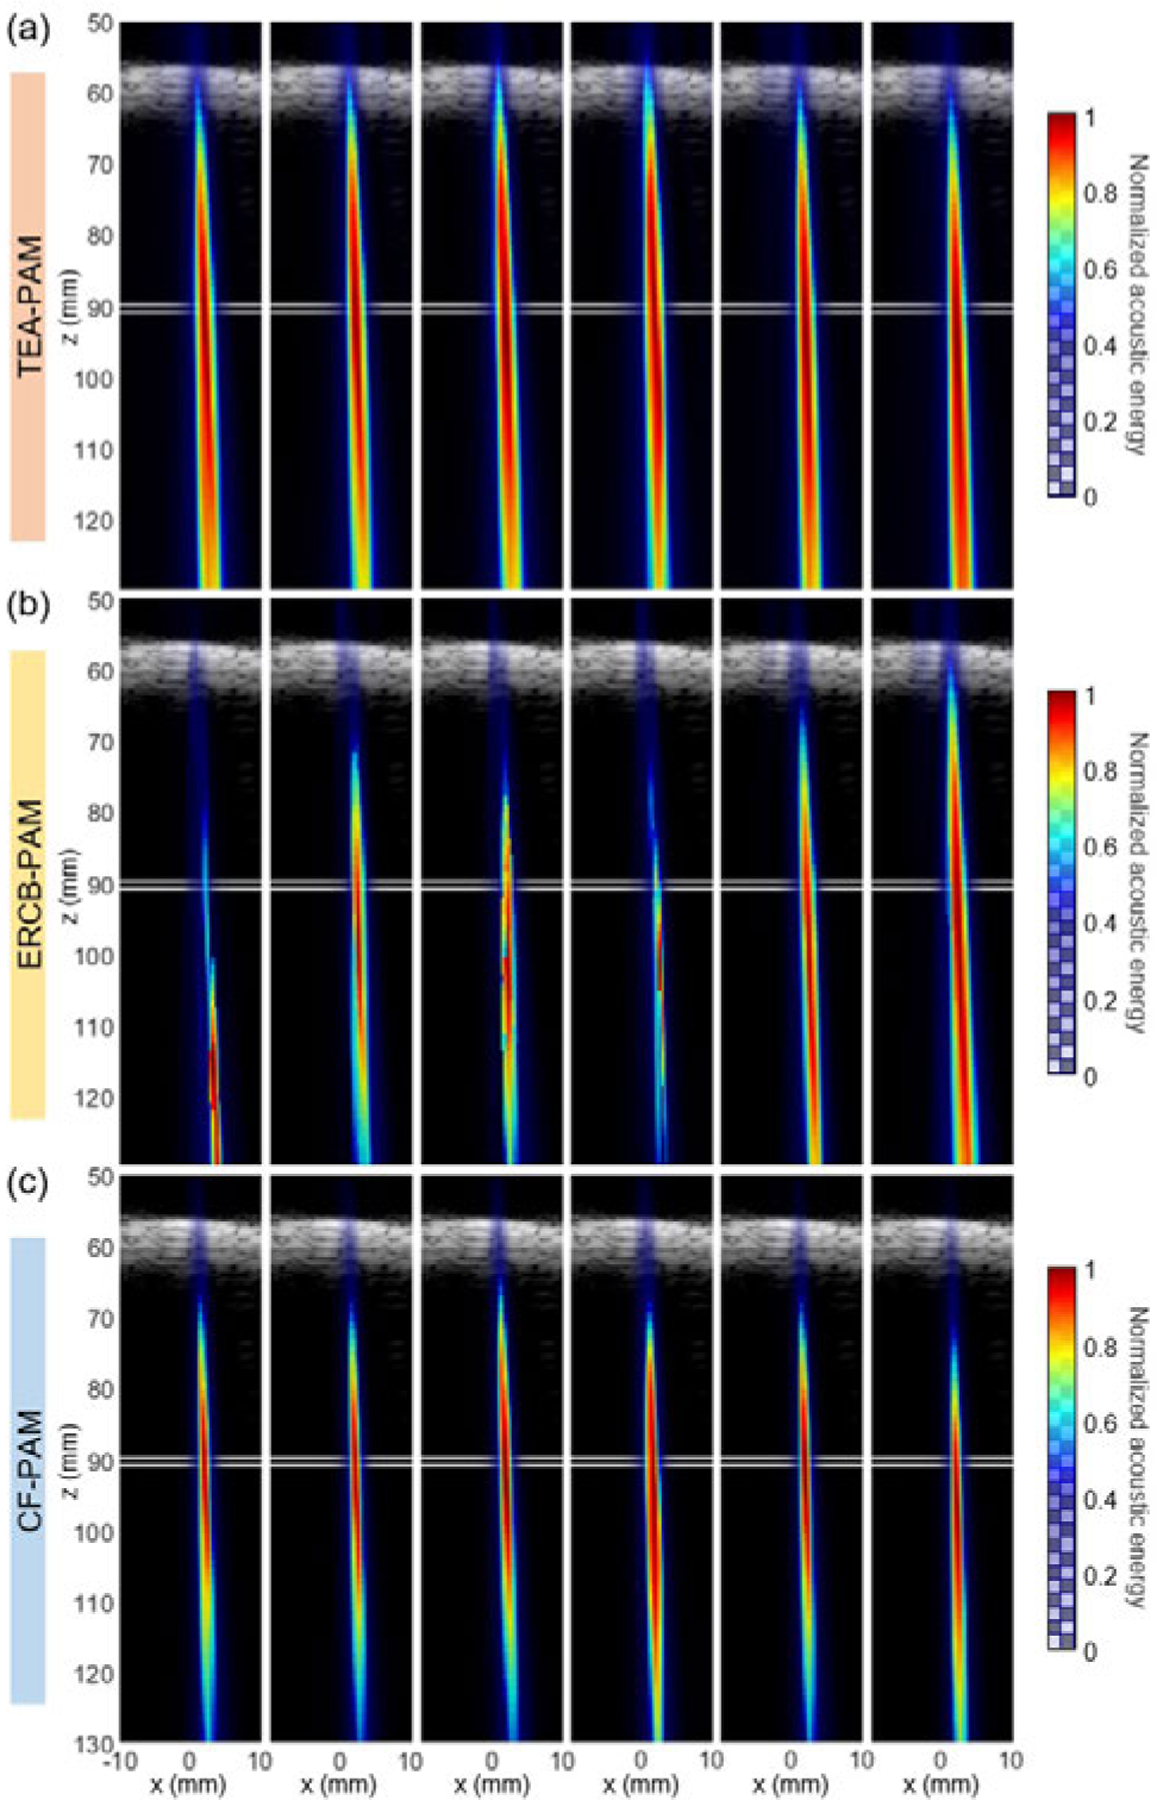
Fig. 4.

Cavitation map (color) reconstructed by using (a) TEA-, (b) ERCB-, and (c) CF-PAM over time overlaid on the B-mode image (grayscale). Human skull fragment appeared in B-mode image at mm. The position of the tube with the microbubbles is indicated by white lines at mm.
