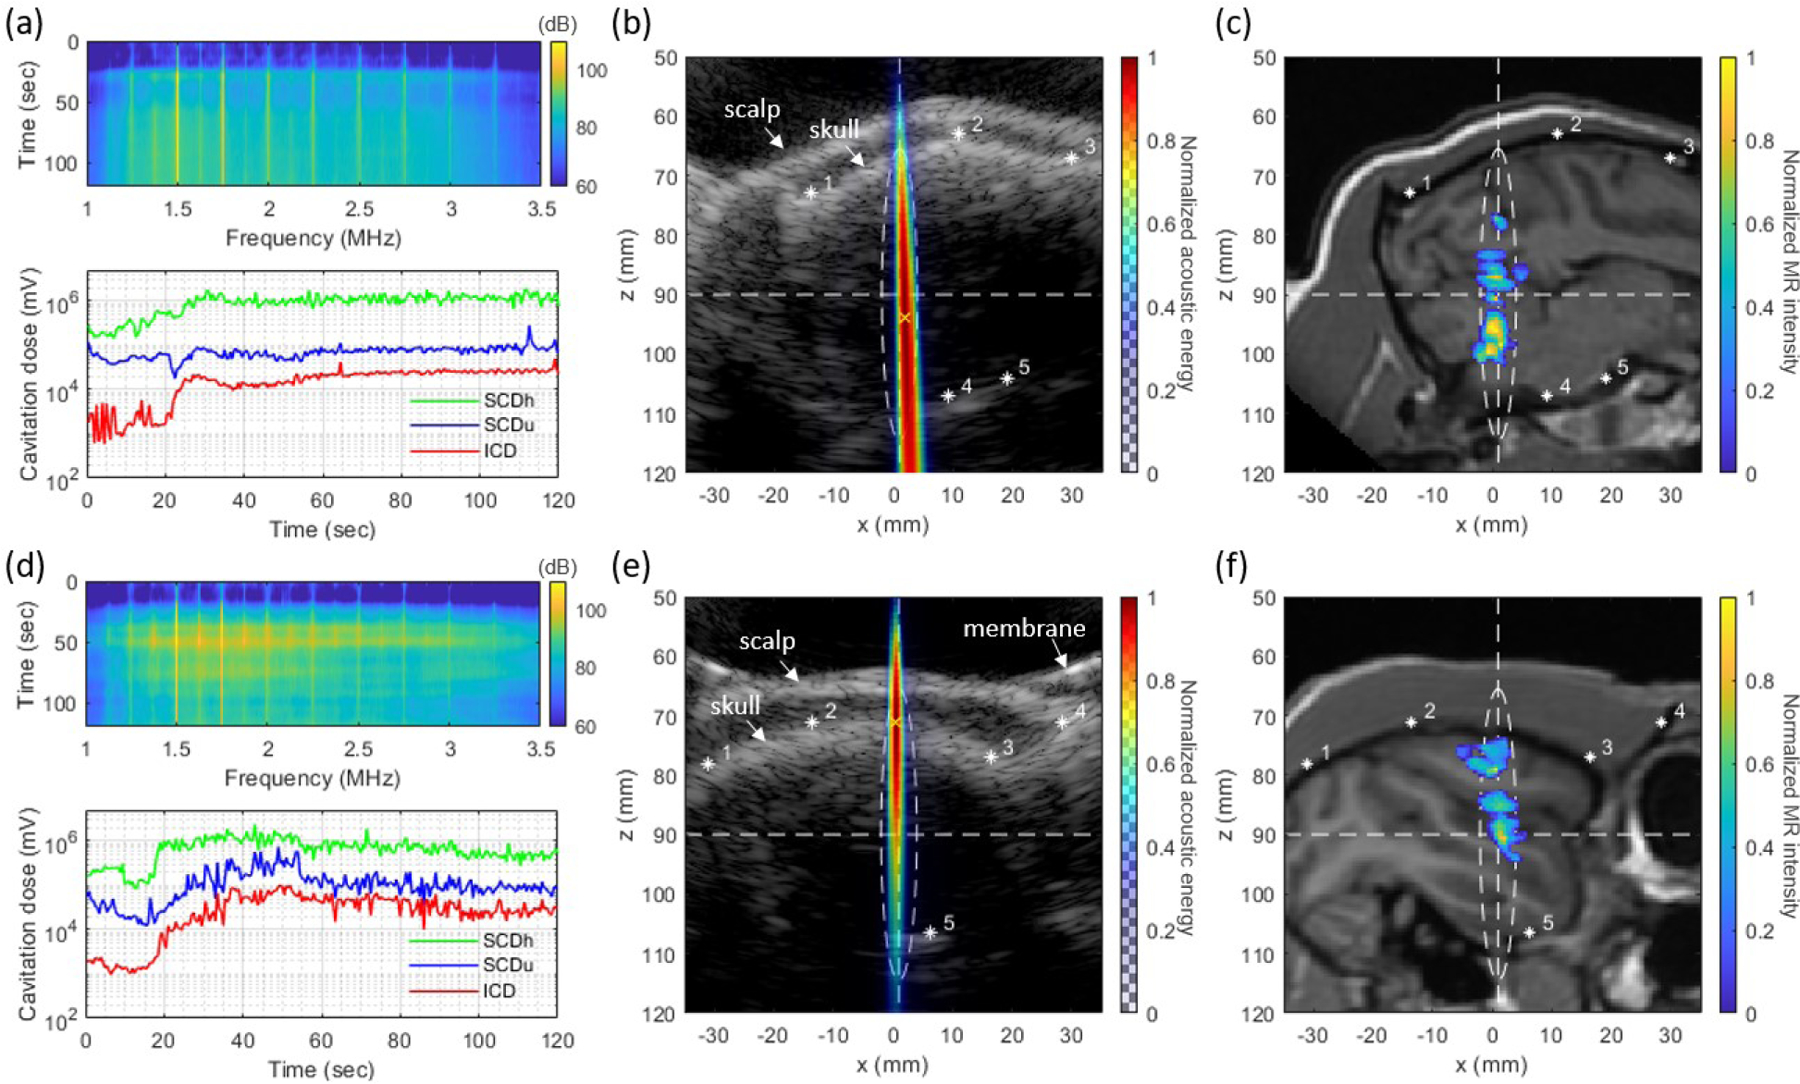
Fig. 5.

In vivo experiment results of (a)–(c) NHP 1 and (d)–(f) NHP 2. (a), (d) Spectrograms of cavitation signal (top panel) and harmonic (SCDh), ultraharmonic (SCDu) and inertial (ICD) cavitation doses (bottom panel), (b), (e) Cumulative acoustic map reconstructed by CF-PAM (color) overlaid on the B-mode image (grayscale), and (c), (f) BBB opening regions (color) overlaid on T1-weighted MRI (grayscale). Asterisks in (b), (c), (e) and (f) indicate the matching anatomical locations in the B-mode and the MR image. A white-dashed ellipse shows −6 dB focal zone and the white-dashed horizontal and vertical lines are showing the lateral and axial location of FUS focus. Videos of real-time cavitation monitoring are available online (MM1 and MM2).
