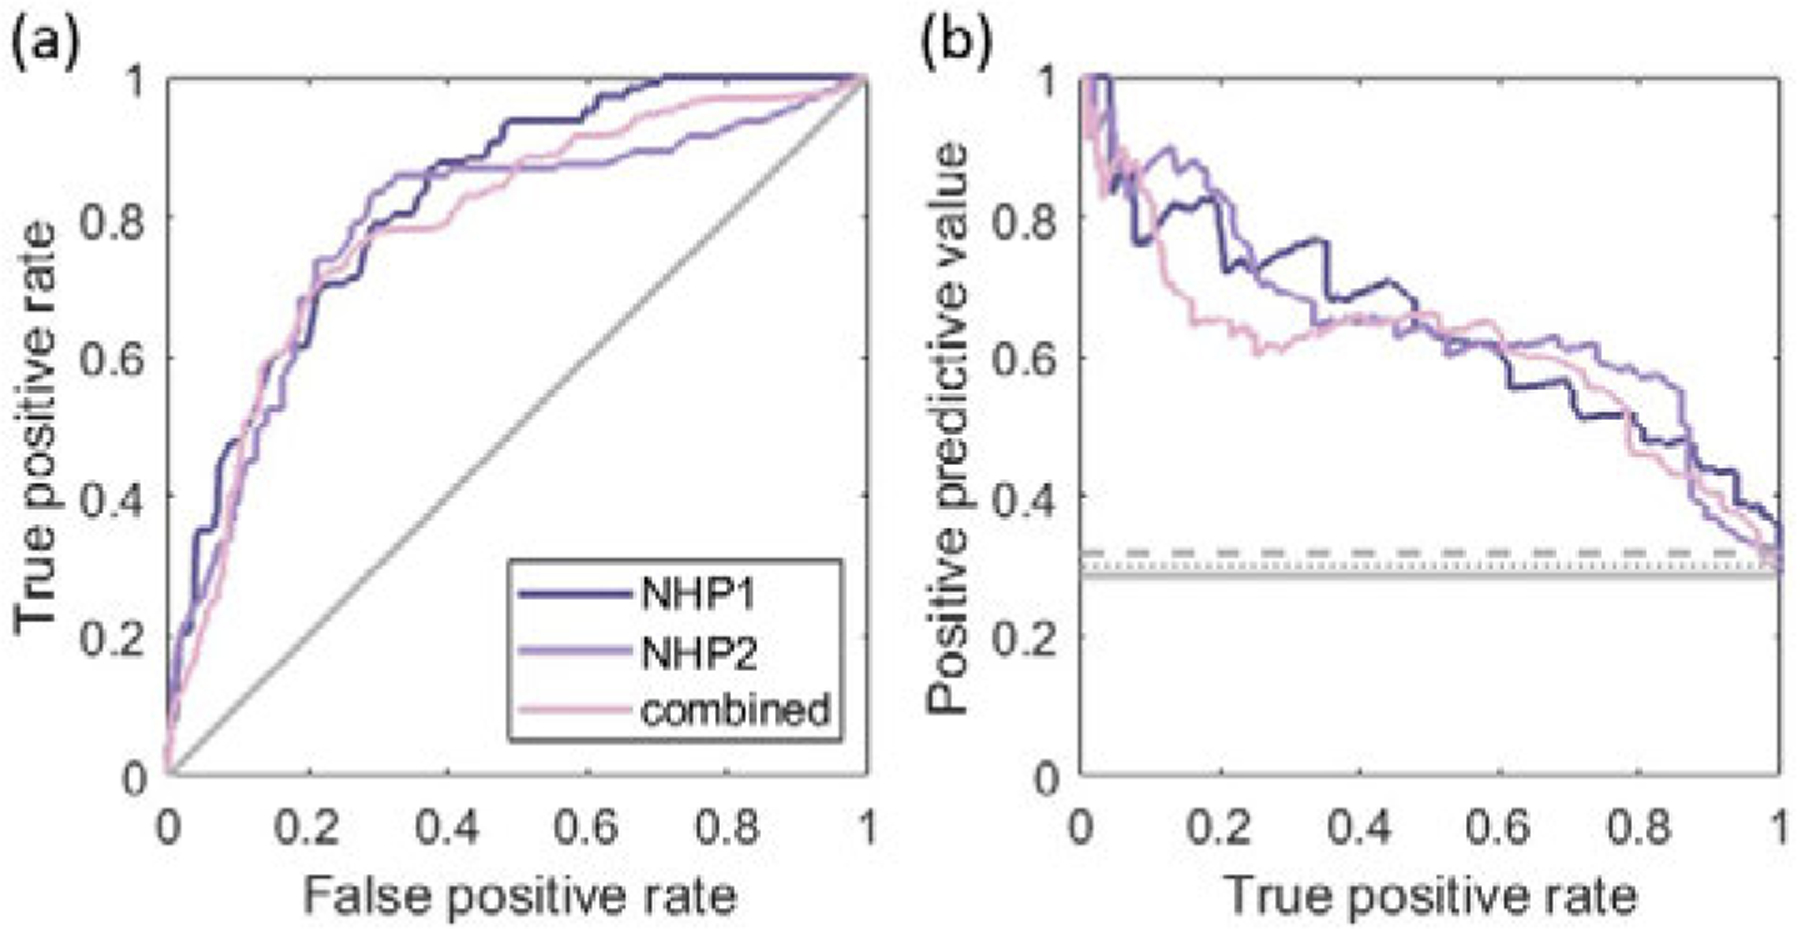
Fig. 6.

(a) ROC curves and (b) PR curves for pixel-wise binary classification of BBB opening with the PAM intensity based on NHP 1, NHP 2, and combined data sets. The solid gray line represents the ROC curve with a random classifier in (a). PR curves with a random classifier are presented by the solid (NHP 1), dashed (NHP 2), and dotted (combined) gray lines in (b).
