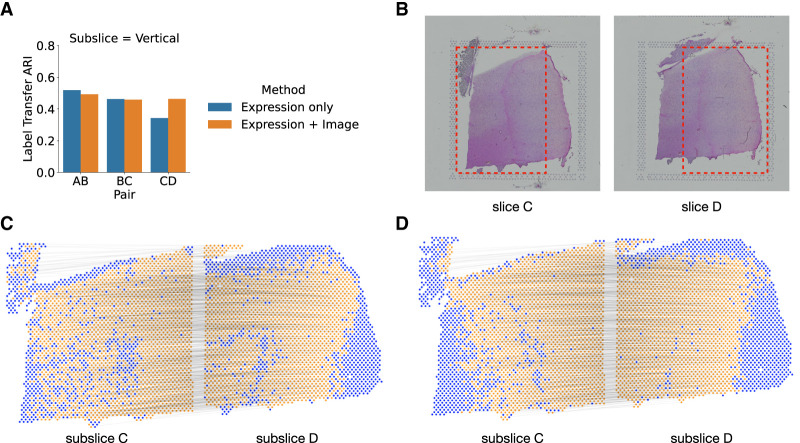
Figure 4.
Evaluating the benefit of using histological image information in PASTE2 alignment. (A) The label transfer ARI (LTARI) of PASTE2 partial alignments of pairs of vertical subslices extracted from DLPFC sample 3 using only gene expression (blue) and using both gene expression and image information (orange). (B) Histological images of sample 3 slice C and slice D. The red boxes bound the vertical subslices extracted for partial alignment. The right part of subslice C should be aligned to the left part of subslice D. (C) Visualization of PASTE2 alignment of the subslice pair CD using gene expression and spatial information. Yellow spots are aligned by PASTE2, whereas blue spots are unaligned. Thin black lines connect pairs of spots that are aligned by PASTE2 with high weight. (D) Visualization of PASTE2 alignment of the same subslice pair when gene expression, histological image, and spatial information are all used.

