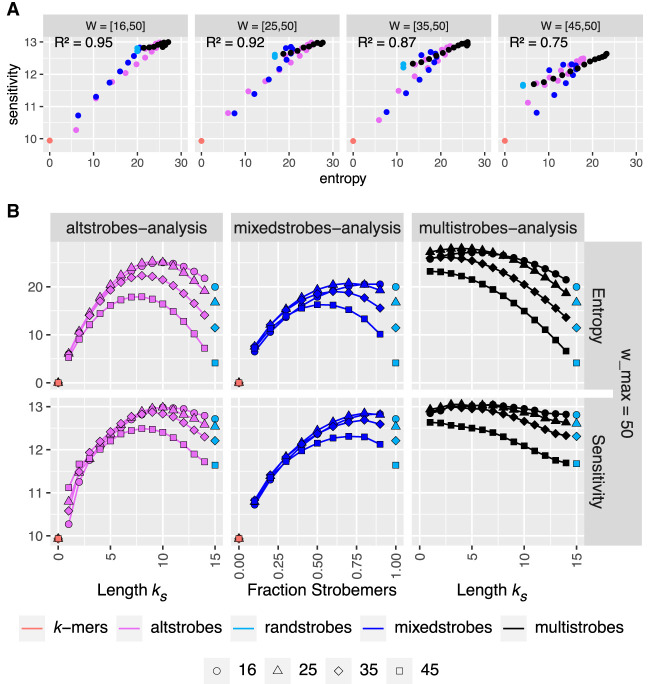
Figure 2.
Entropy and Sensitivity relationship of seeds. Panel A shows the relationship between entropy (x-axis) and sum of sensitivity over different mutation rates (y-axis) for various window sizes indicated by the coefficient of determination (square of the Pearson correlation coefficient). Panel B shows H(X|Y) (upper row) and summed sensitivity over various mutation rates (lower row) for k-mers, randstrobes, altstrobes for different strobe length parametrizations (x-axis) and window sizes (tick mark shapes).

