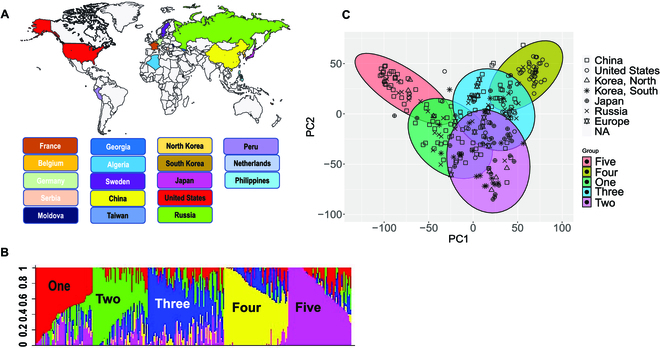
Fig. 1.

Geographical origin and population structure of soybean association panel. (A) Geographical countries of origin for soybean accessions phenotyped for 2D RSA and root morphology traits. (B) Five subpopulations were identified based on structure analysis of the 286 soybean lines. Structure analysis was conducted by using ~12,000 genome-wide SNPs using the STRUTURE software with 10 iterations of 12,000 burning periods. (C) Principal components analysis was performed with 367,303 randomly selected genome-wide SNPs in R by using the prcomp function. The PCA analysis results are consistent with the existence of 5 subpopulations.
