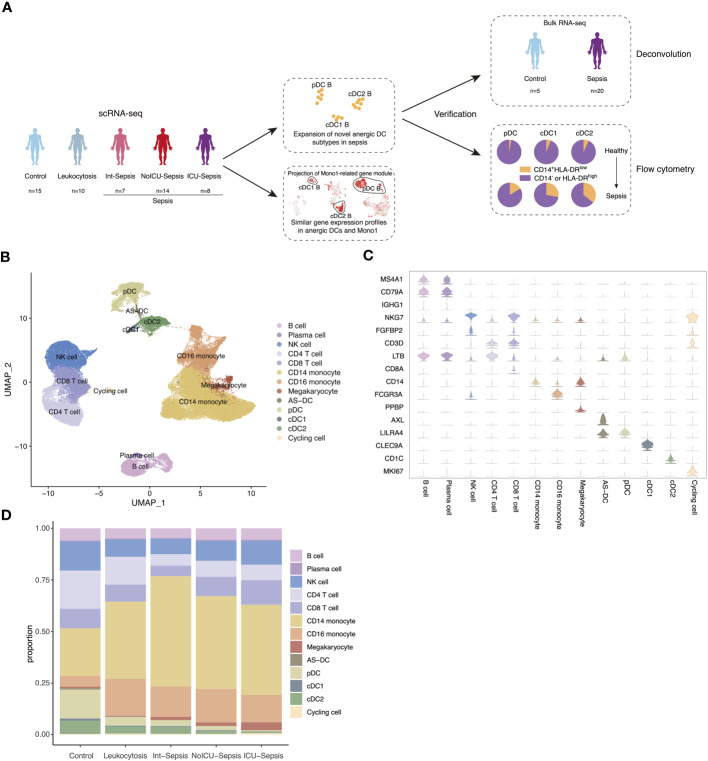
Figure 1.
Single-cell atlas of septic patients. (A) Schematic diagram of study overview. Sample numbers indicated for each dataset. (B) Uniform manifold approximation and projection (UMAP) of cell types in the single-cell dataset of 82273 cells derived from septic patients and control participants. (C) Violin plots of canonical annotation marker genes (rows) for different cell types (columns). (D) Bar plot showing cell proportion in different groups.

