Figure 2.
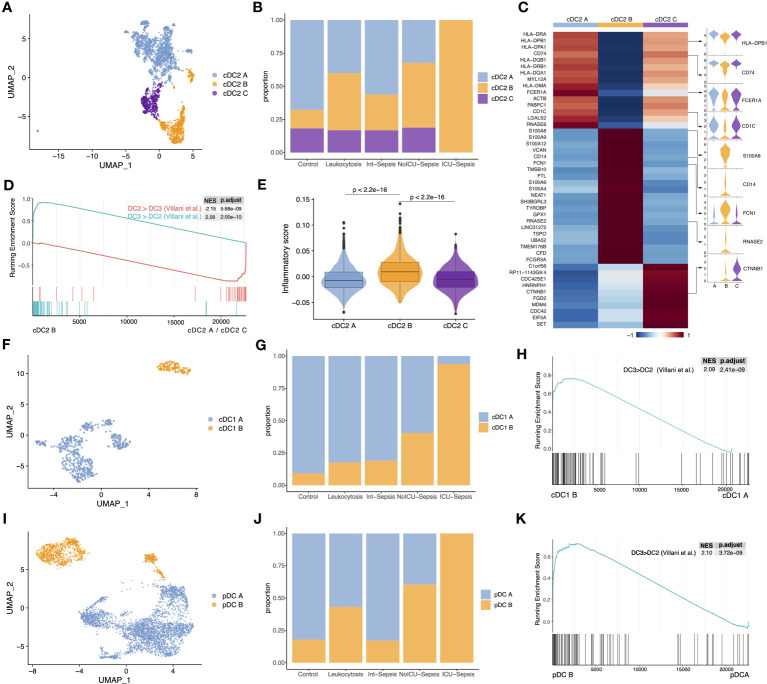
The proportion of three anergic DC subtypes significantly increased in sepsis. (A) UMAP presentation of three cDC2 subtypes. (B) Cell proportion of three cDC2 subtypes across different groups. (C) Heatmap of top marker genes across the three cDC2 subtypes (left). Violin plots for the expression of selected marker genes (right). (D) GSEA of pairwise comparisons of cDC2 B with cDC2 A and cDC2 C. ‘DC3 > DC2’ gene set contained genes highly expressed in DC3, while ‘DC2 > DC3’ gene set contained genes highly expressed in DC2. (E) Inflammatory score across three cDC2 subtypes. Significance was determined using Wilcoxon signed-rank test. (F) UMAP presentation of two cDC1 subtypes. (G) Cell proportion of two cDC1 subtypes across different groups. (H) GSEA of pairwise comparisons of cDC1 B with cDC1 A. (I) UMAP presentation of two pDC subtypes. (J) Cell proportion of two pDC subtypes across different groups. (K) GSEA of pairwise comparisons of pDC B with pDC A.

