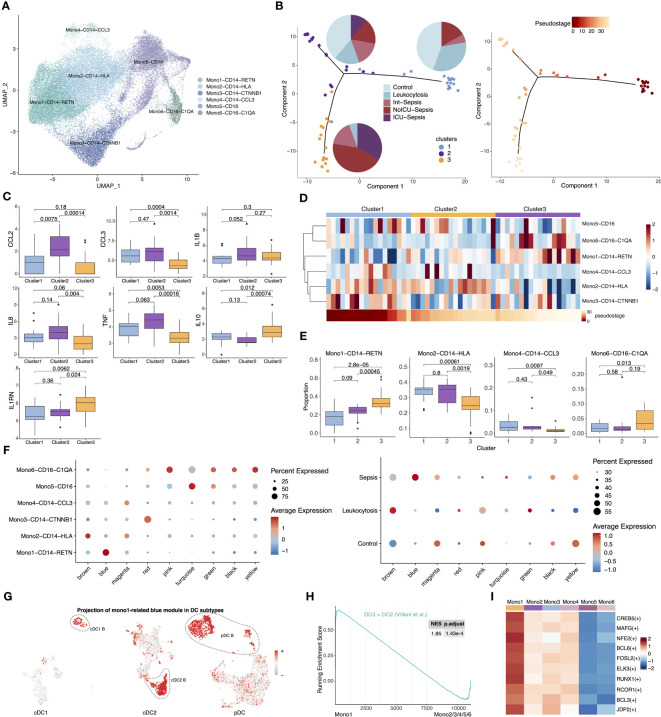
Figure 4.
Comparison of gene expression profiles between immunesuppressive Mono1 and anergic DCs. (A) UMAP presentation of six monocyte subtypes. (B) Visualization of samples from septic patients colored by cluster (left) and pseudostage (right). Proportion of sample states for each cluster are shown in the left panel as pie charts. (C) Expression of pro-inflammatory and anti-inflammatory cytokines across three clusters. Significance was determined using Student’s t test. (D) Proportion of six monocyte subtypes across three clusters (top). Heatmap in the bottom showed ordered pseudostage for each sample. (E) Boxplots showing proportion of four monocyte subtypes (Mono1-CD14-RETN, Mono2-CD14-HLA, Mono4-CD14-CCL3, Mono6-CD16-C1QA) in each sample from the indicated clusters. Significance was determined using Student’s t test. (F) The expression level of the co-expression gene modules across six monocyte subtypes (left) and different groups (right). (G) The expression of Mono1-related blue gene module in cDC1, cDC2 and pDC subtypes. (H) GSEA of pairwise comparisons of Mono1 with other monocyte subtypes. (I) Top upregulated TFs of Mono1 in contrast to other five monocyte subtypes.

