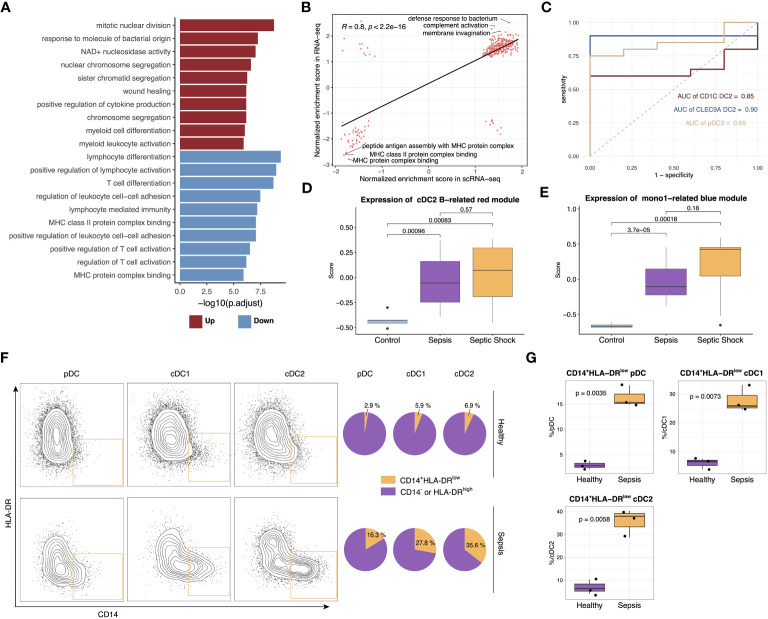
Figure 6.
Verification of scRNA-seq findings with bulk RNA-seq and flow cytometry. (A) Top upregulated and downregulated GO terms in septic patients versus healthy controls. (B) Scatterplots showing correlation between pathway normalized enrichment score in scRNA-seq data and RNA-seq data. The pathway normalized enrichment score was calculated using GSEA. Pathways with p <0.05 were included in the analysis. Significance of the correlations (Pearson r) were calculated with a two-sided permutation test. (C) ROC curves for the diagnostic effectiveness of proportion of cDC1 B, cDC2 B and pDC B in all DCs in the bulk RNA-seq data. (D) Boxplot showing the expression of genes from cDC2 B-related red module in different groups. Significance was determined using Student’s t test. (E) Boxplot showing the expression of genes from Mono1-related blue module in different groups. Significance was determined using Student’s t test. (F) The frequency of CD14+HLA-DRlow DC subsets in the sepsis patients and healthy control. (G) Boxplot showing the difference in the proportion of CD14+HLA-DRlow pDC, cDC1 and cDC2 between sepsis patients and healthy controls. Significance was determined using Student’s t test.

