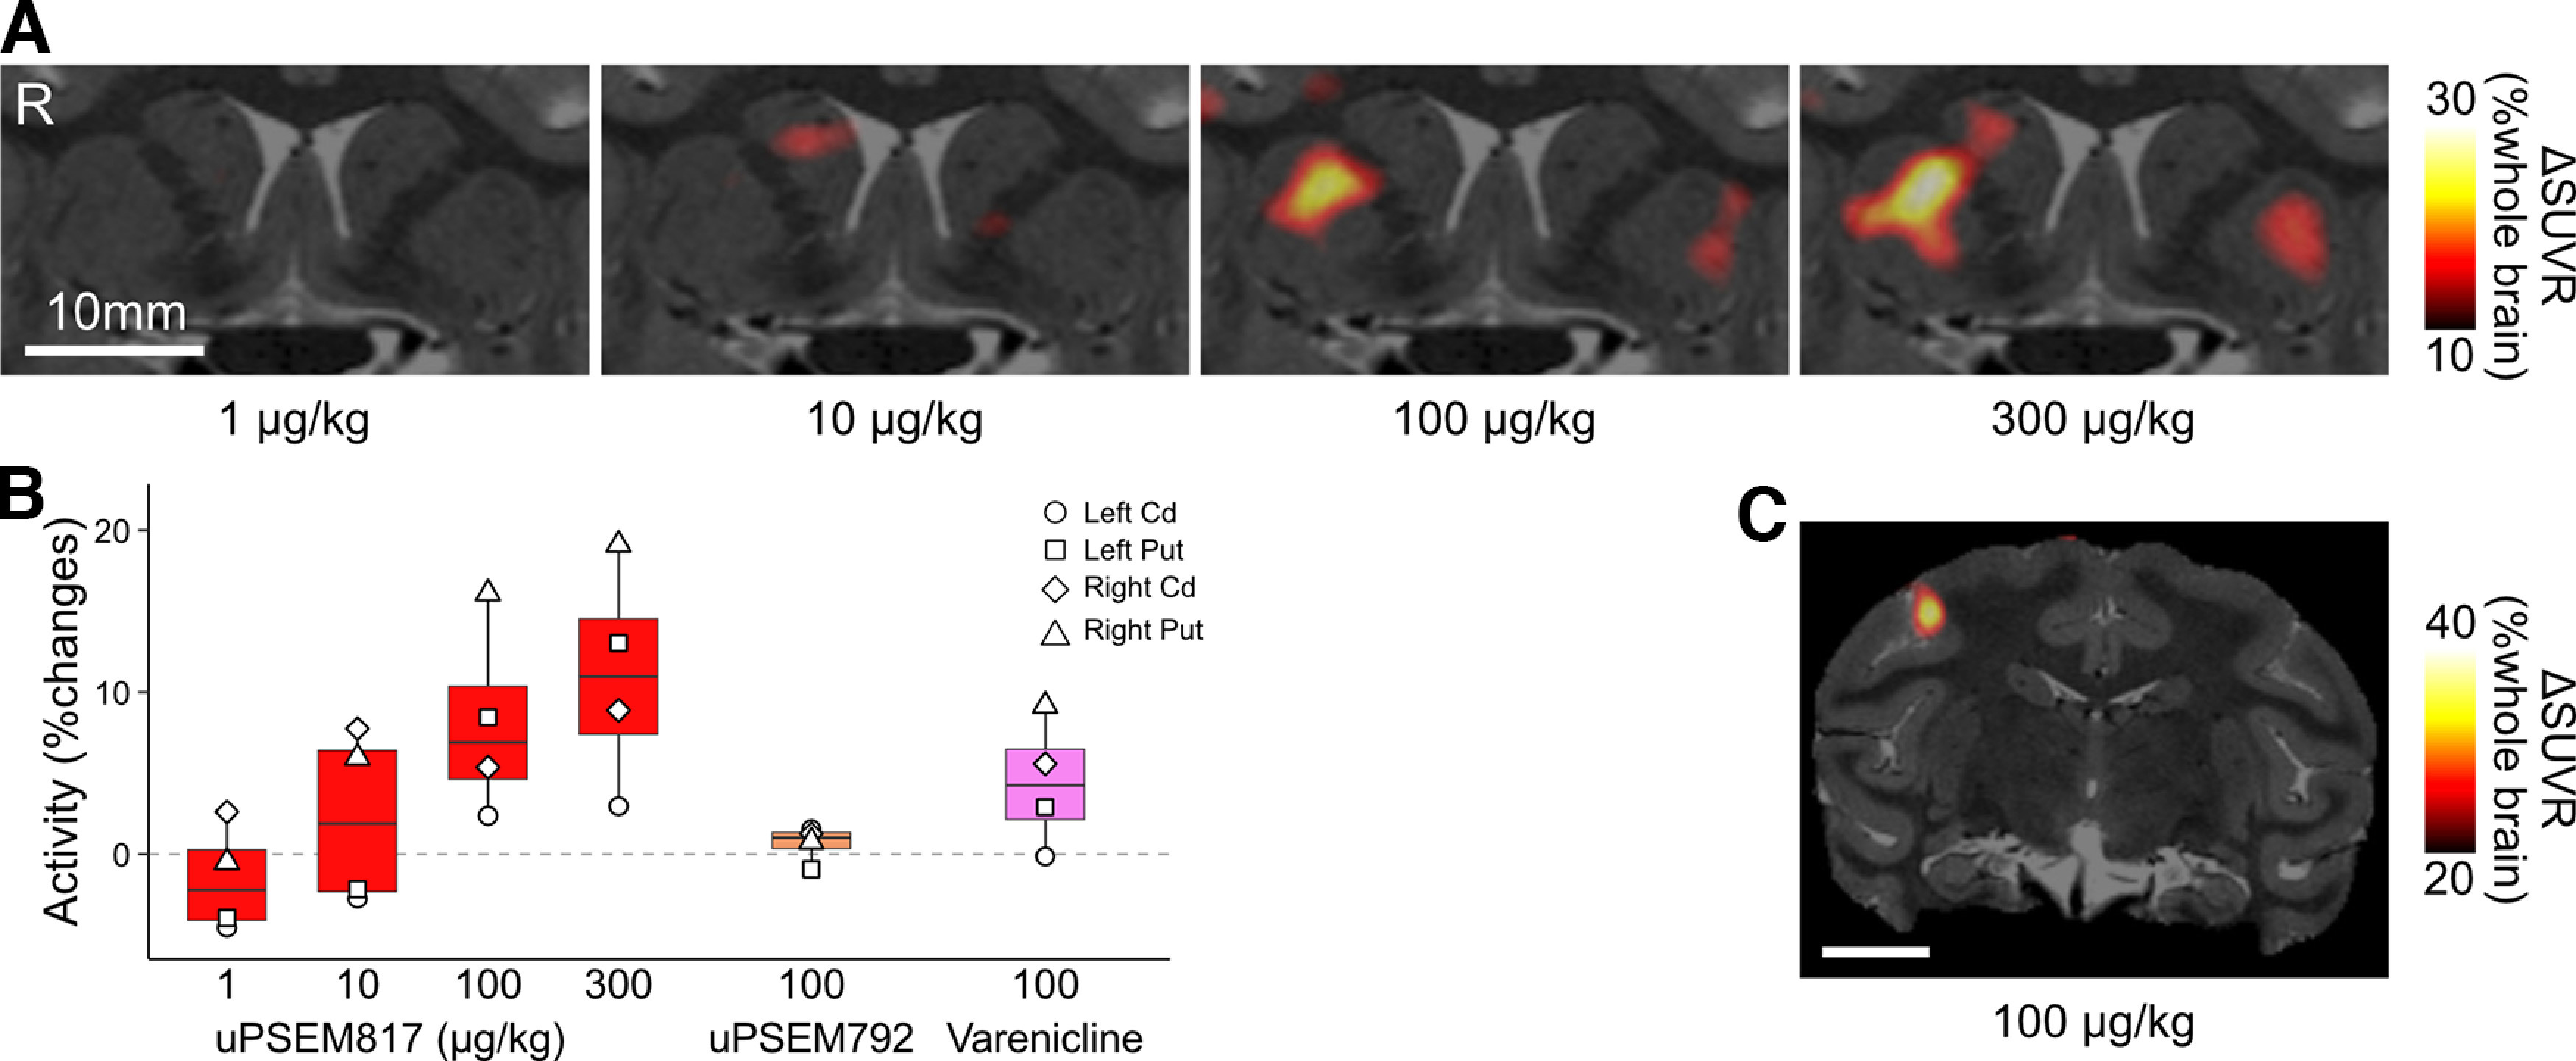
Figure 4.

FDG-PET assessment of chemogenetic activation using PSEMs. A, Coronal sections of ΔSUVR [18F]FDG-PET images overlayed with an MR image indicate chemogenetically induced metabolic changes via PSAM4-5HT3 activation in striatal regions following uPSEM817 administration (1–300 µg/kg, n = 1 for each dose). ΔSUVR (color coded) indicates the change in SUVR (values for uPSEM817 minus those for vehicle). B, Comparison of chemogenetic effects of different ligands (red: uPSEM817; orange: uPSEM792; pink: varenicline) and their doses. Chemogenetically induced metabolic activity (bars and symbols indicate averages and striatal VOIs, respectively) was normalized by the values from the vehicle condition and plotted. C, A coronal SUVR contrast image overlayed with an MR image expressing PSAM4-5HT3 in the MI. Data obtained from MK#1. R, right, Cd, caudate nucleus, Put, putamen.
