
Figure 5.
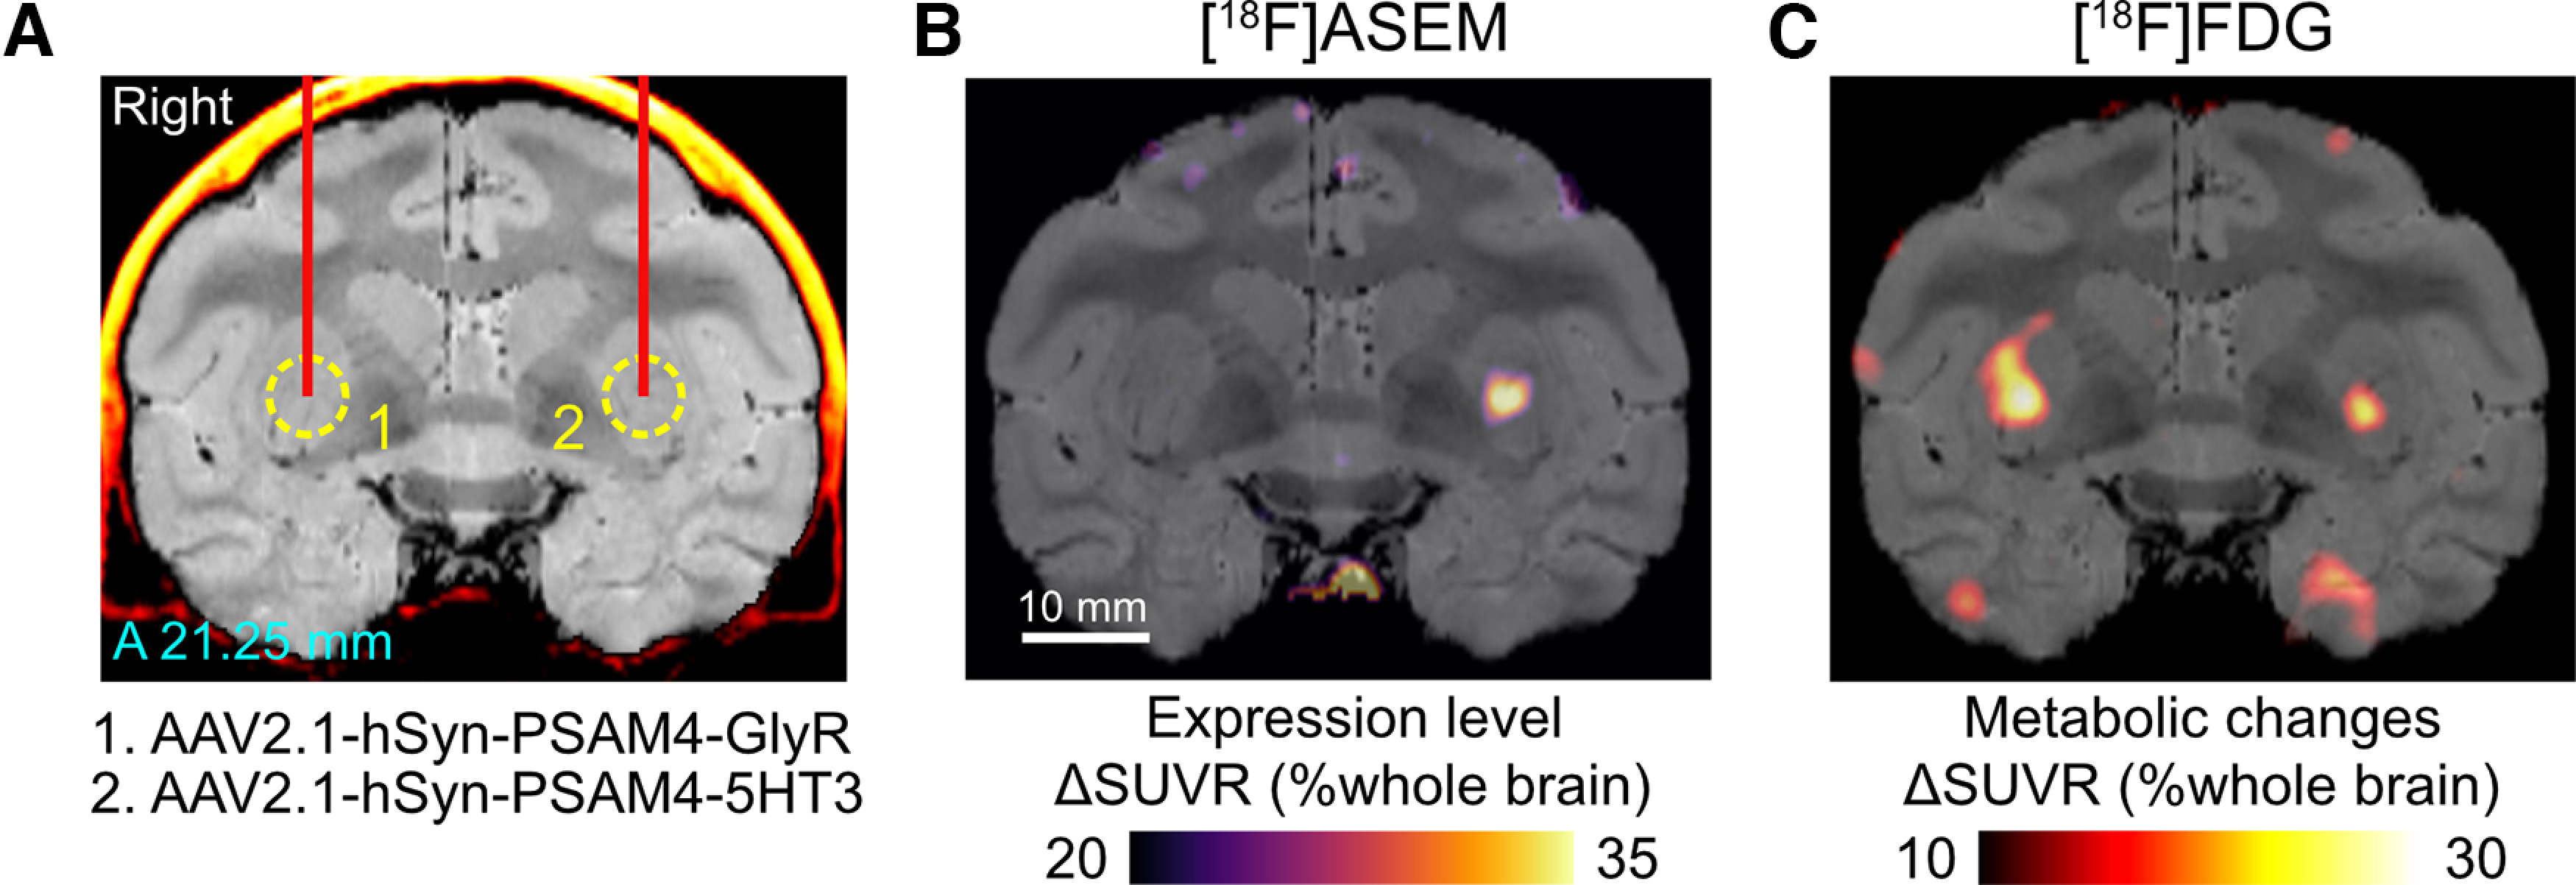
PET validation of PSAM4 expression and function in MK#2. A, Location of viral vector injections are shown on a coronal CT-MR fusion image, 21.25 mm anterior to the ear-bar zero line. AAV2.1 vectors expressing PSAM4-GlyR and PSAM4-5HT3 were injected into the right and left putamen, respectively. B, ΔSUVR image showing increased [18F]ASEM uptake in the striatum where the vector expressing PSAM4-5HT3 was injected. Notable increase was not found in the right PUT (PSAM4-GlyR-side). C, A coronal ΔSUVR section of [18F]FDG-PET overlayed with an MR image indicate increased metabolic activity following uPSEM817 administration (300 µg/kg, i.v.). Data obtained from MK#2. A, anterior.