
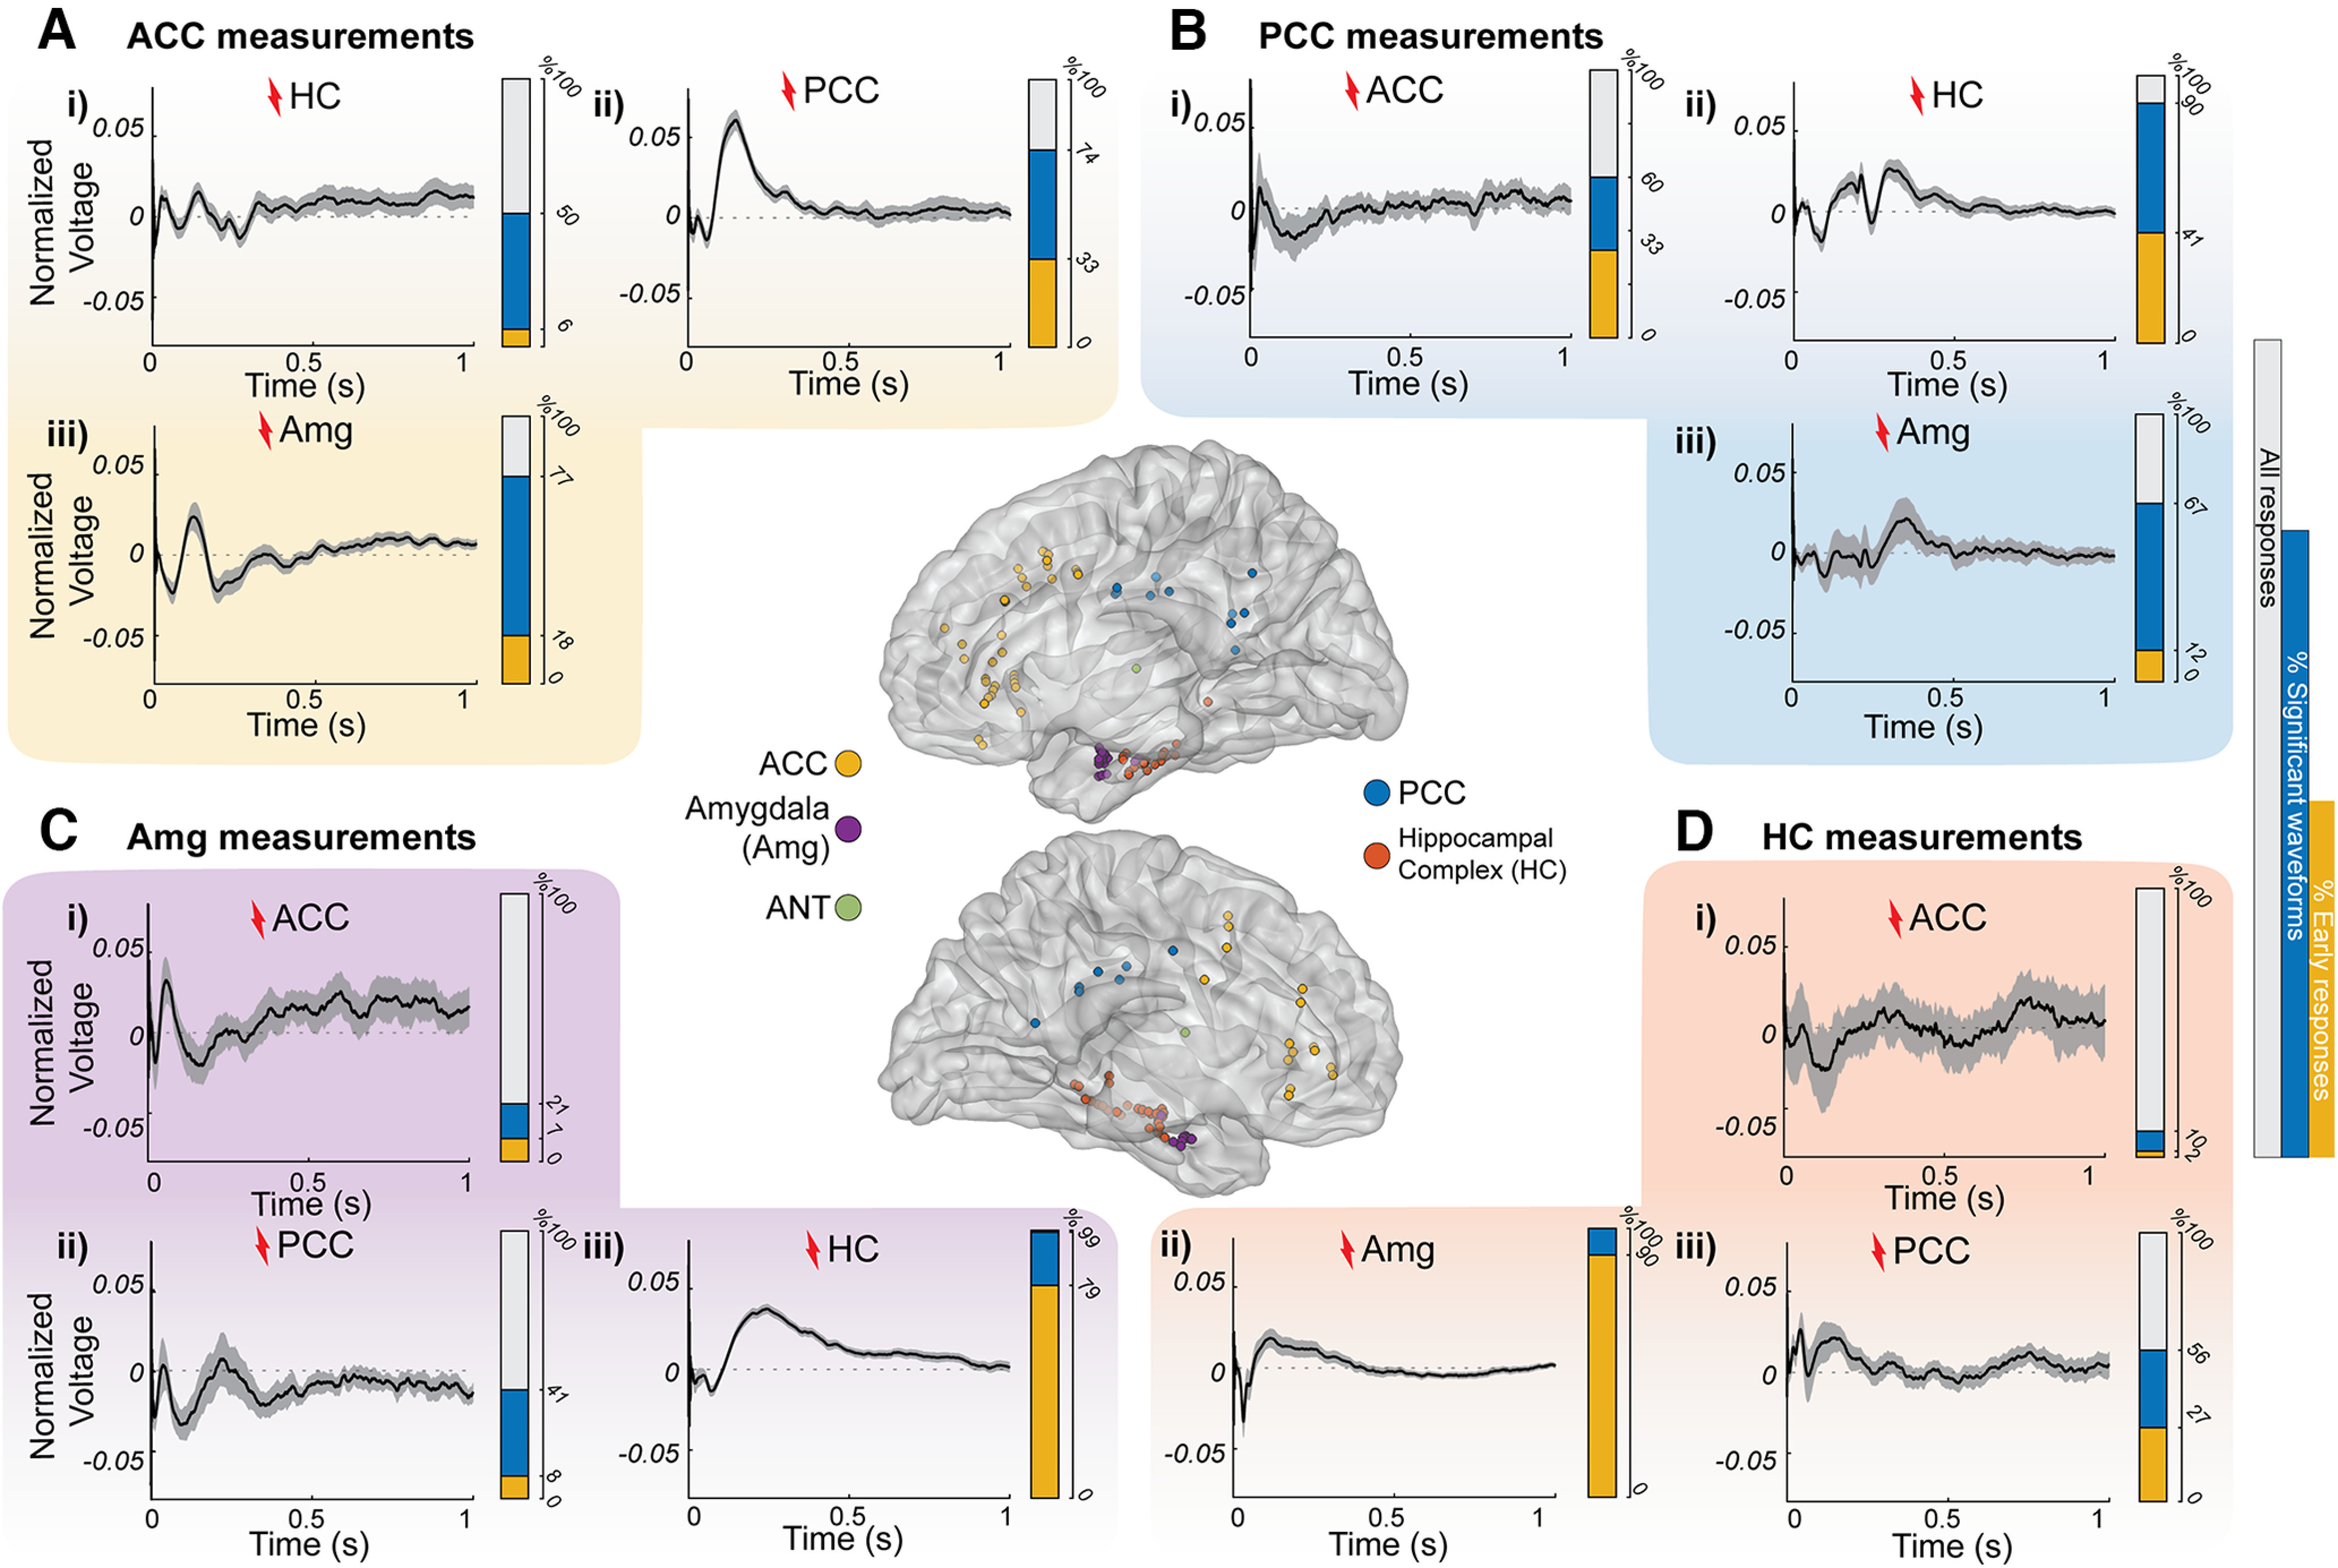
Stimulation-driven waveforms in limbic connections across subjects. Ai–Diii, MNI brain renderings of right (top) and left (bottom) hemispheres with the electrode sites where the signals shown were measured and stimulated. Extended Data Figures 2-1 and 2-2 show the coverage in individual subjects. The average of all significant L2-normalized CCEPs (thicker black line) plotted over time with a 95% confidence interval (gray shadow) is shown. Ai–iii, Measurements in the ACC after HC (i), PCC (ii), and amygdala (iii) stimulation. Bi–iii, Measurements in the PCC after ACC (i), HC (ii), and amygdala (iii) stimulation. Ci–iii, Measurements in the amygdala after ACC (i), PCC (ii), and HC (iii) stimulation. Di–iii, Measurements in the HC after ACC (i), amygdala (ii), and PCC (iii) stimulation. Extended Data Figures 2-3 and 2-4 show normalized responses in individual subjects of direct HC–Amg connections. Additionally, each panel contains a bar representing overlays of all CCEP connections (gray) with the percentage of significant responses (blue, based on CRP method cross-trial reliability) and significant responses with a significant early response from 15 to 50 ms (yellow portion).