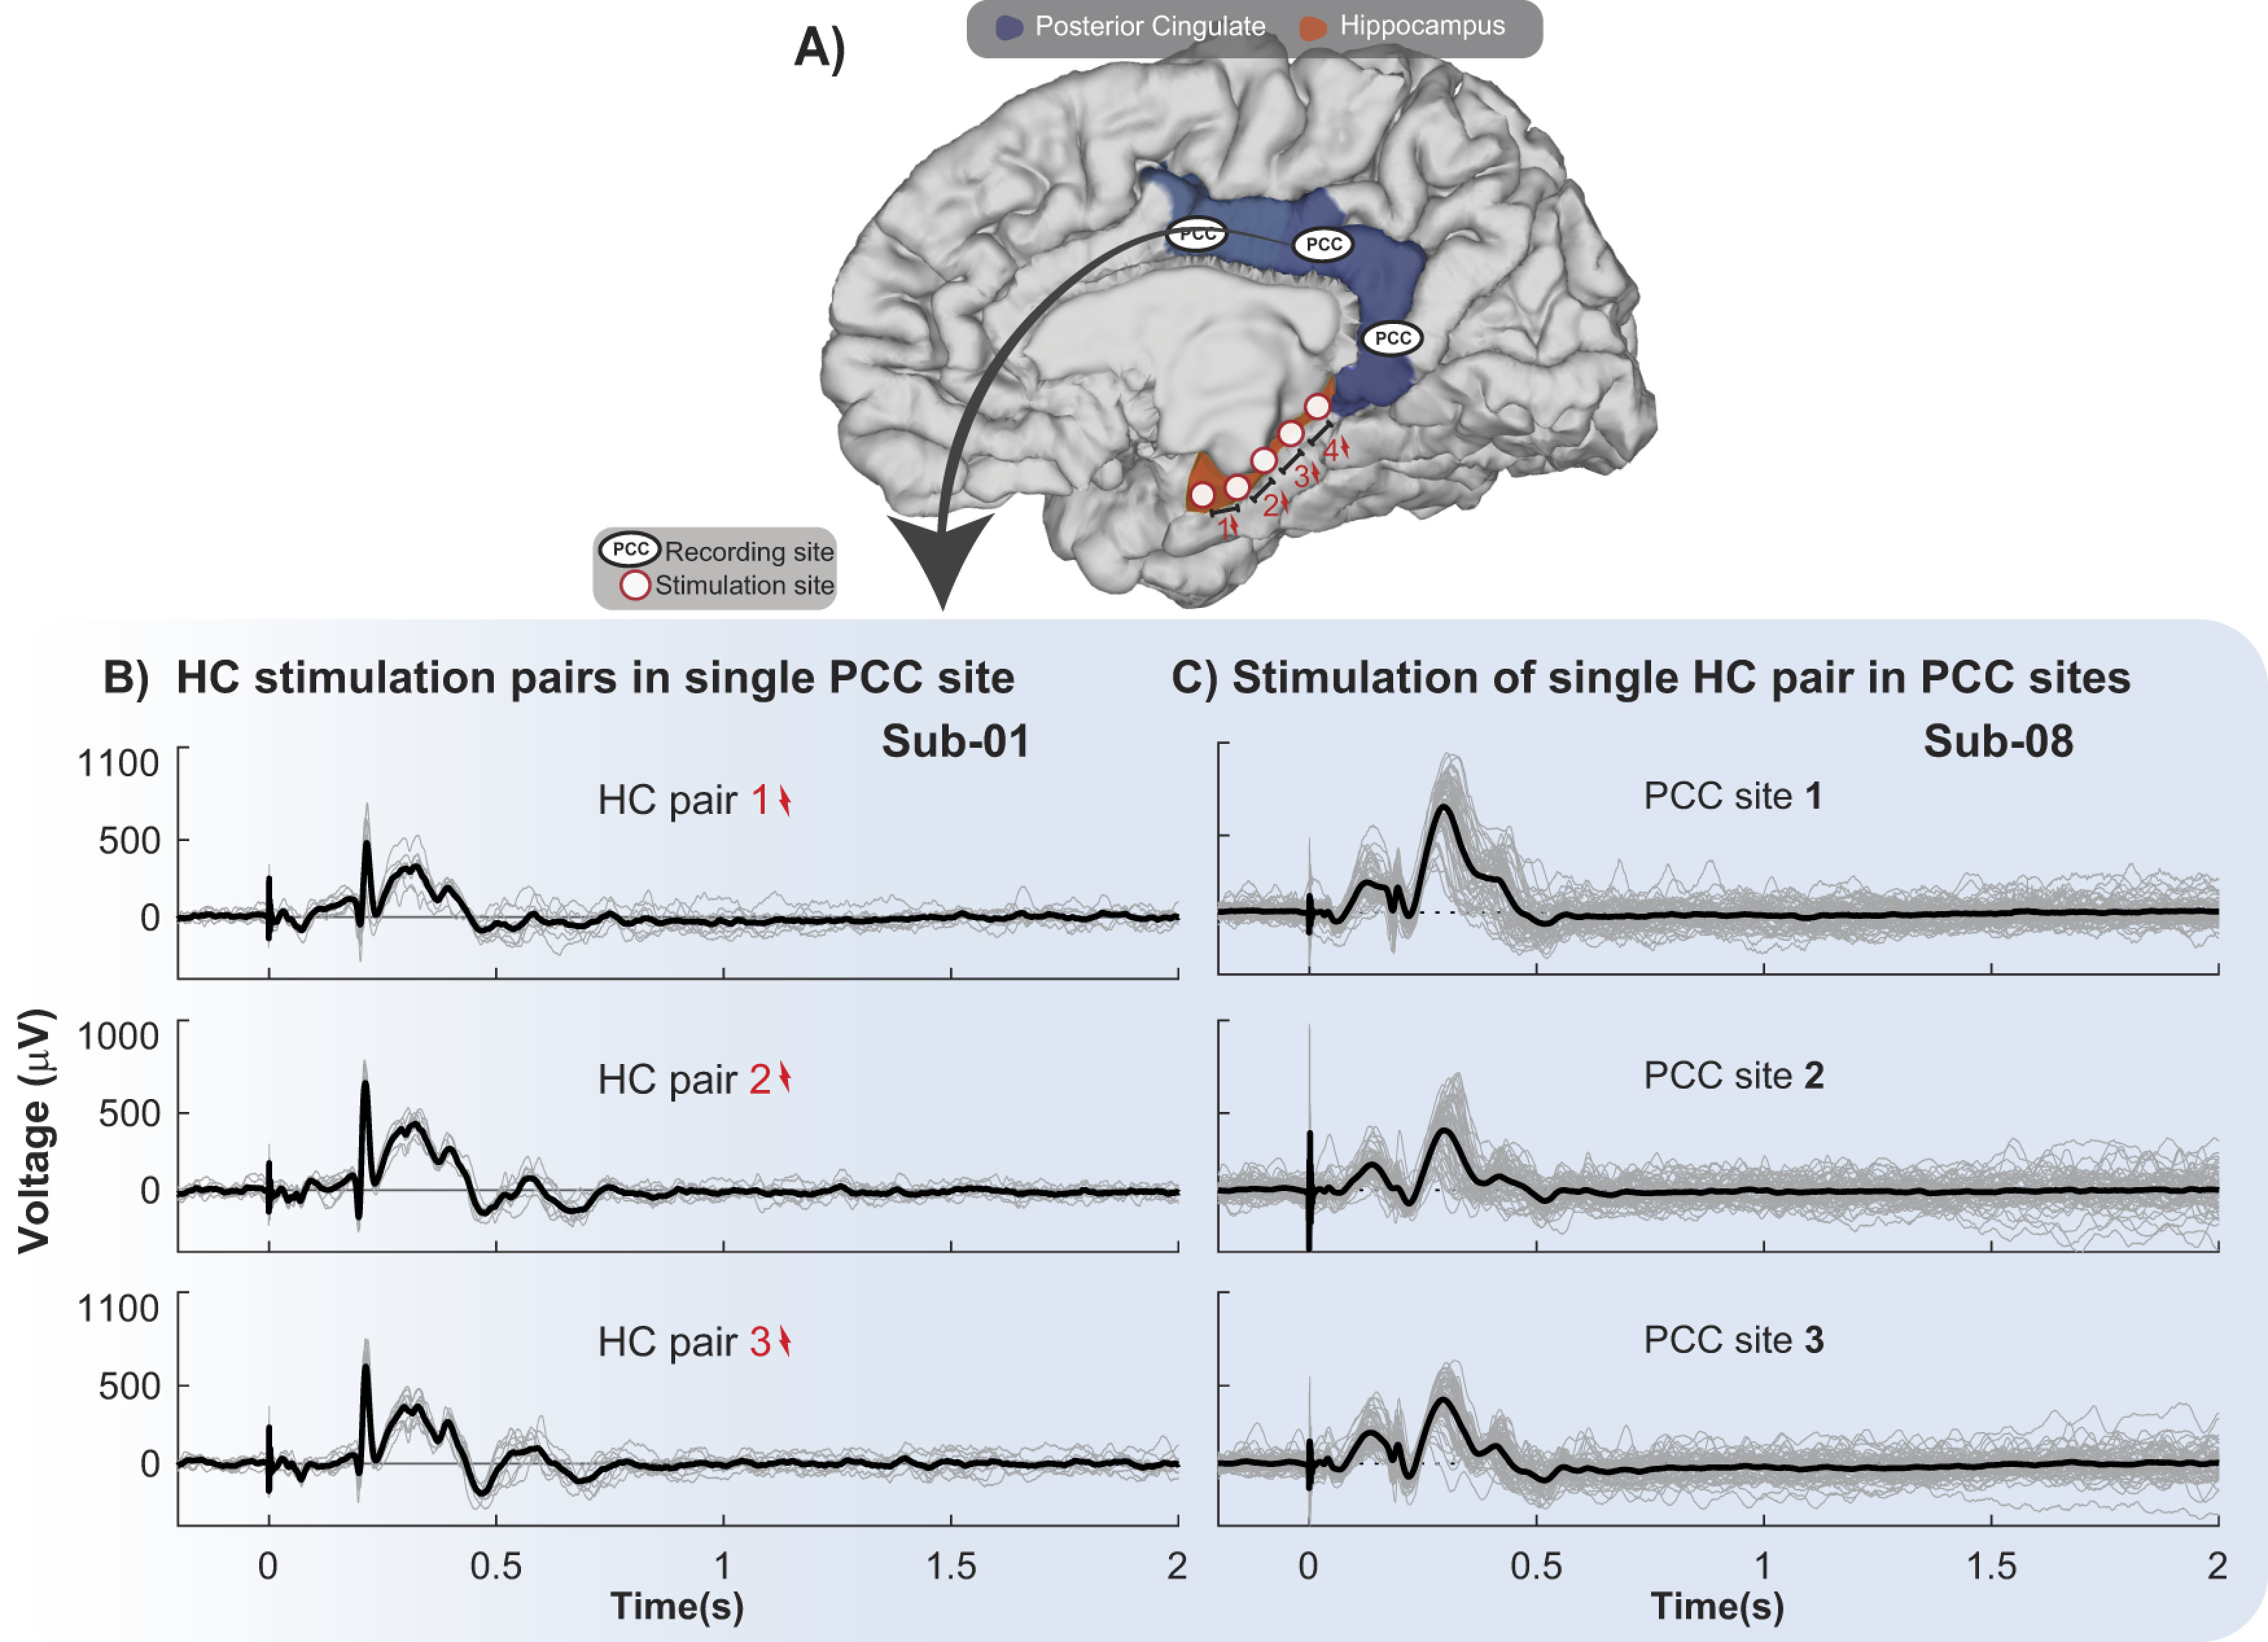
Figure 3.

Significant PCC CCEP waveforms are reliable when stimulating along the HC and recording in the PCC across trials. A, Brain schematic with representative recording and stimulation sites, with PCC (blue) and outline of the hippocampal complex HC (orange), since hippocampus is located underneath the cortical surface. B, C, Individual CCEP trials (µV; gray lines) and average response (black line) after stimulating HC electrodes denoted in two different subjects. Stimulation onset is at time 0. B, CCEP waveforms from a single contact in PCC in subject 1 (Sub-01) after stimulating different pairs of electrodes in the HC 10 times. C, CCEP waveforms from different contacts in the PCC in subject 8 (Sub-08) after stimulation of a single HC pair of electrodes 55 times.
