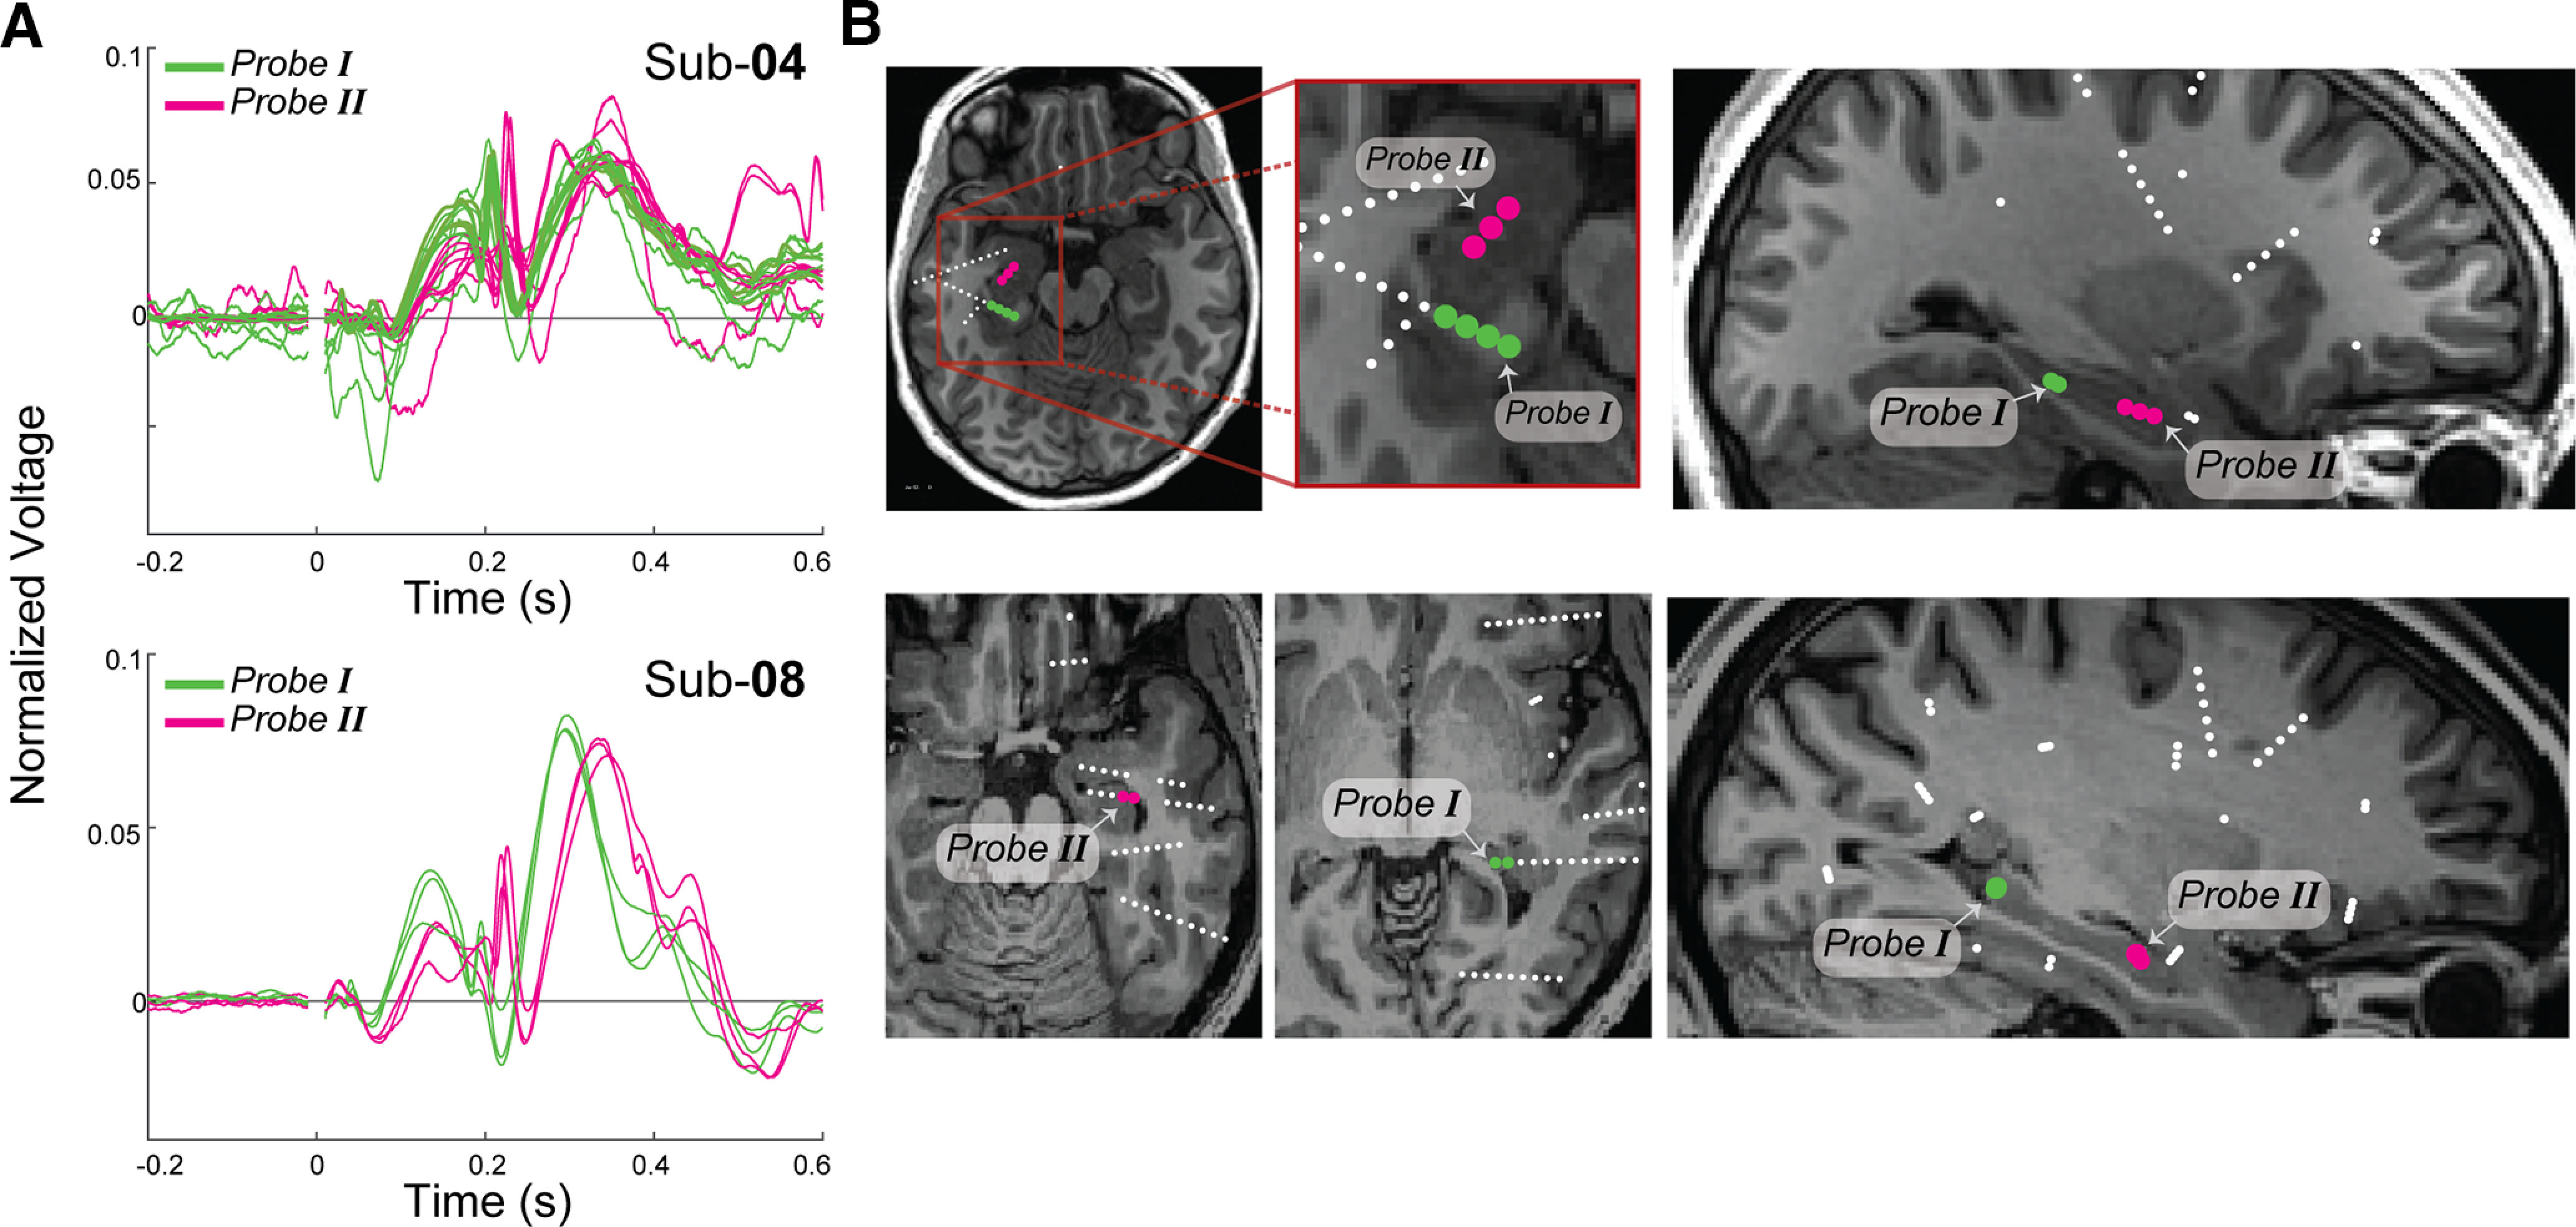
Figure 6.

Location of HC stimulation sites and latency of PCC responses. A, Normalized limbic HAP-waves (L2 normalized) measured in PCC after HC stimulation are plotted as a function of time for subjects 4 (Sub-04) and 8 (Sub-08). Significant limbic HAP-waves on stimulation of Probe I (in green) and Probe II (in magenta). B, Axial (left) and sagittal (right) view with an estimation of the stimulated electrodes (contacts in Probe I in green; contacts in Probe II in magenta).
