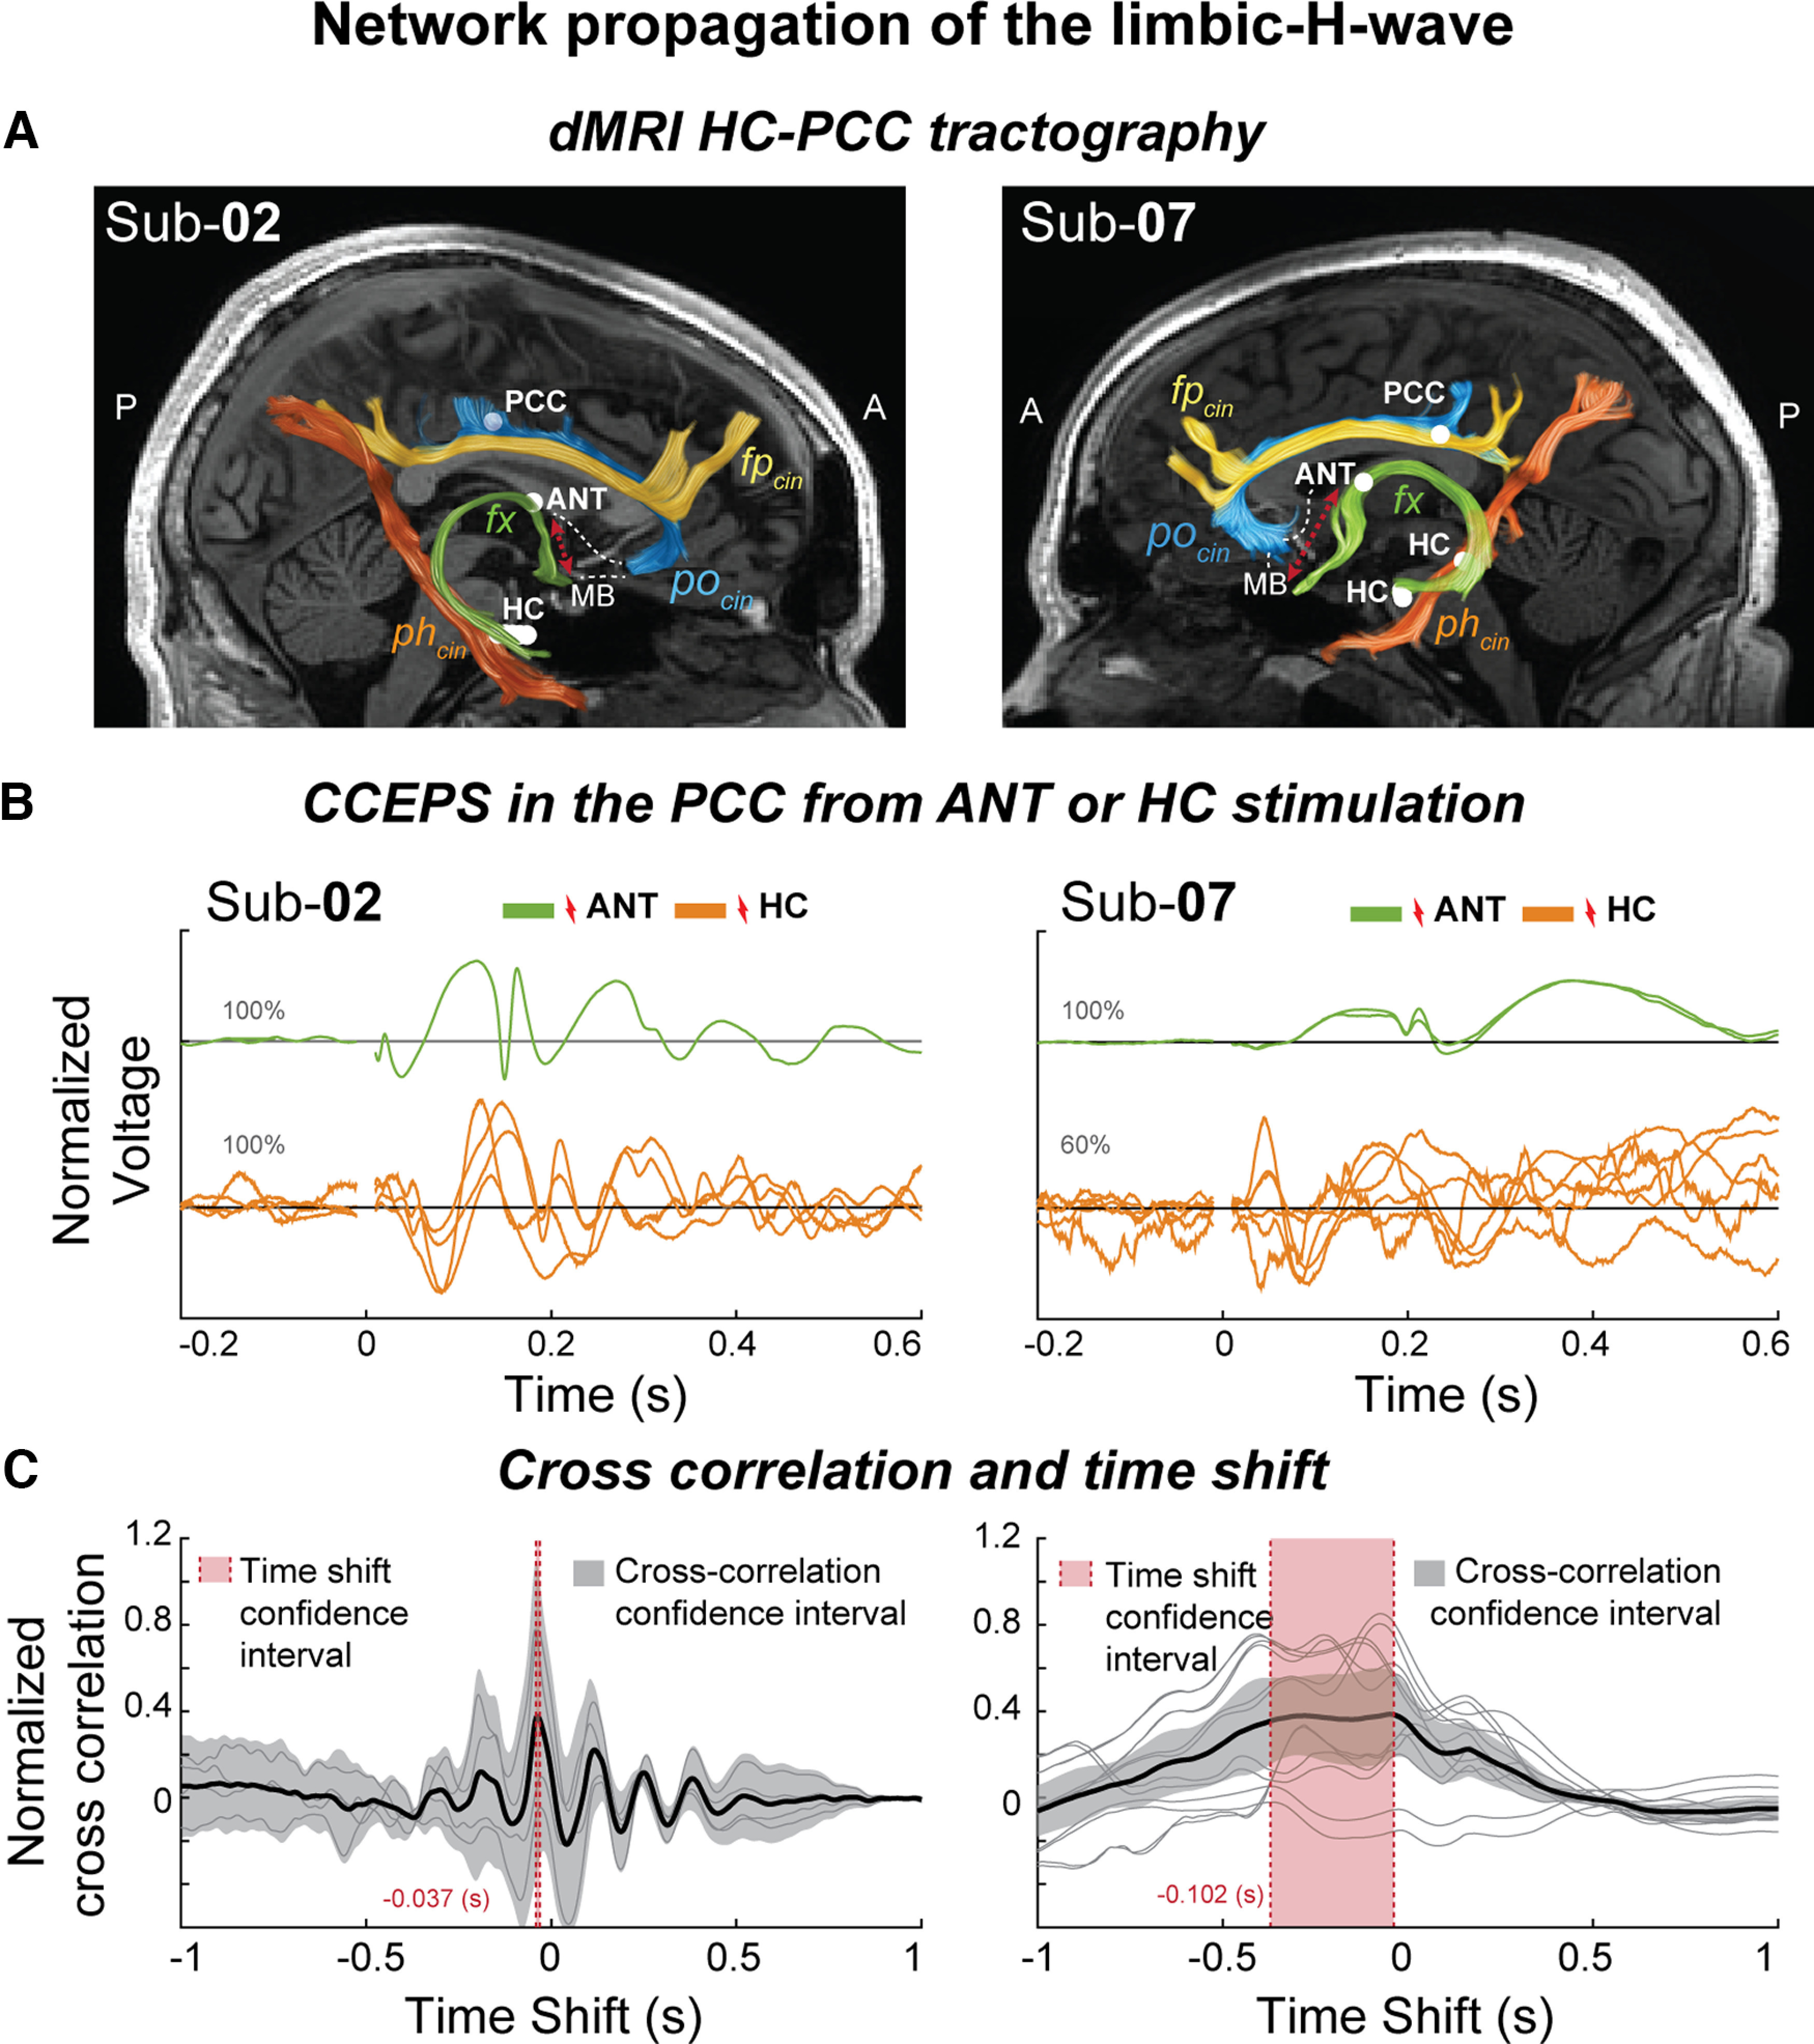
Figure 7.

Limbic H-waves under ANT stimulation with reduced latencies suggests an anterior propagation route. A, dMRI estimates of the fx (green tract), phcin (orange tract), fpcin (yellow), and pocin (blue), and estimated locations of the recording and stimulation sites in the PCC, HC, and ANT (white circles). Additionally, the representative mammillothalamic tract (dotted red line) connecting the MB and the ANT is shown. B, L2-normalized PCC CCEPs under ANT (green) and hippocampal (orange) stimulation, plotted over time. C, Normalized cross-correlations over time shift in seconds. Single cross-correlations (gray) and their average (black, 95% confidence interval, transparent gray). CCEPs in the PCC time shift after ANT stimulation compared with HC stimulation (95% confidence interval, transparent red). Sub-02, Subject 2; Sub-07, subject 7.
