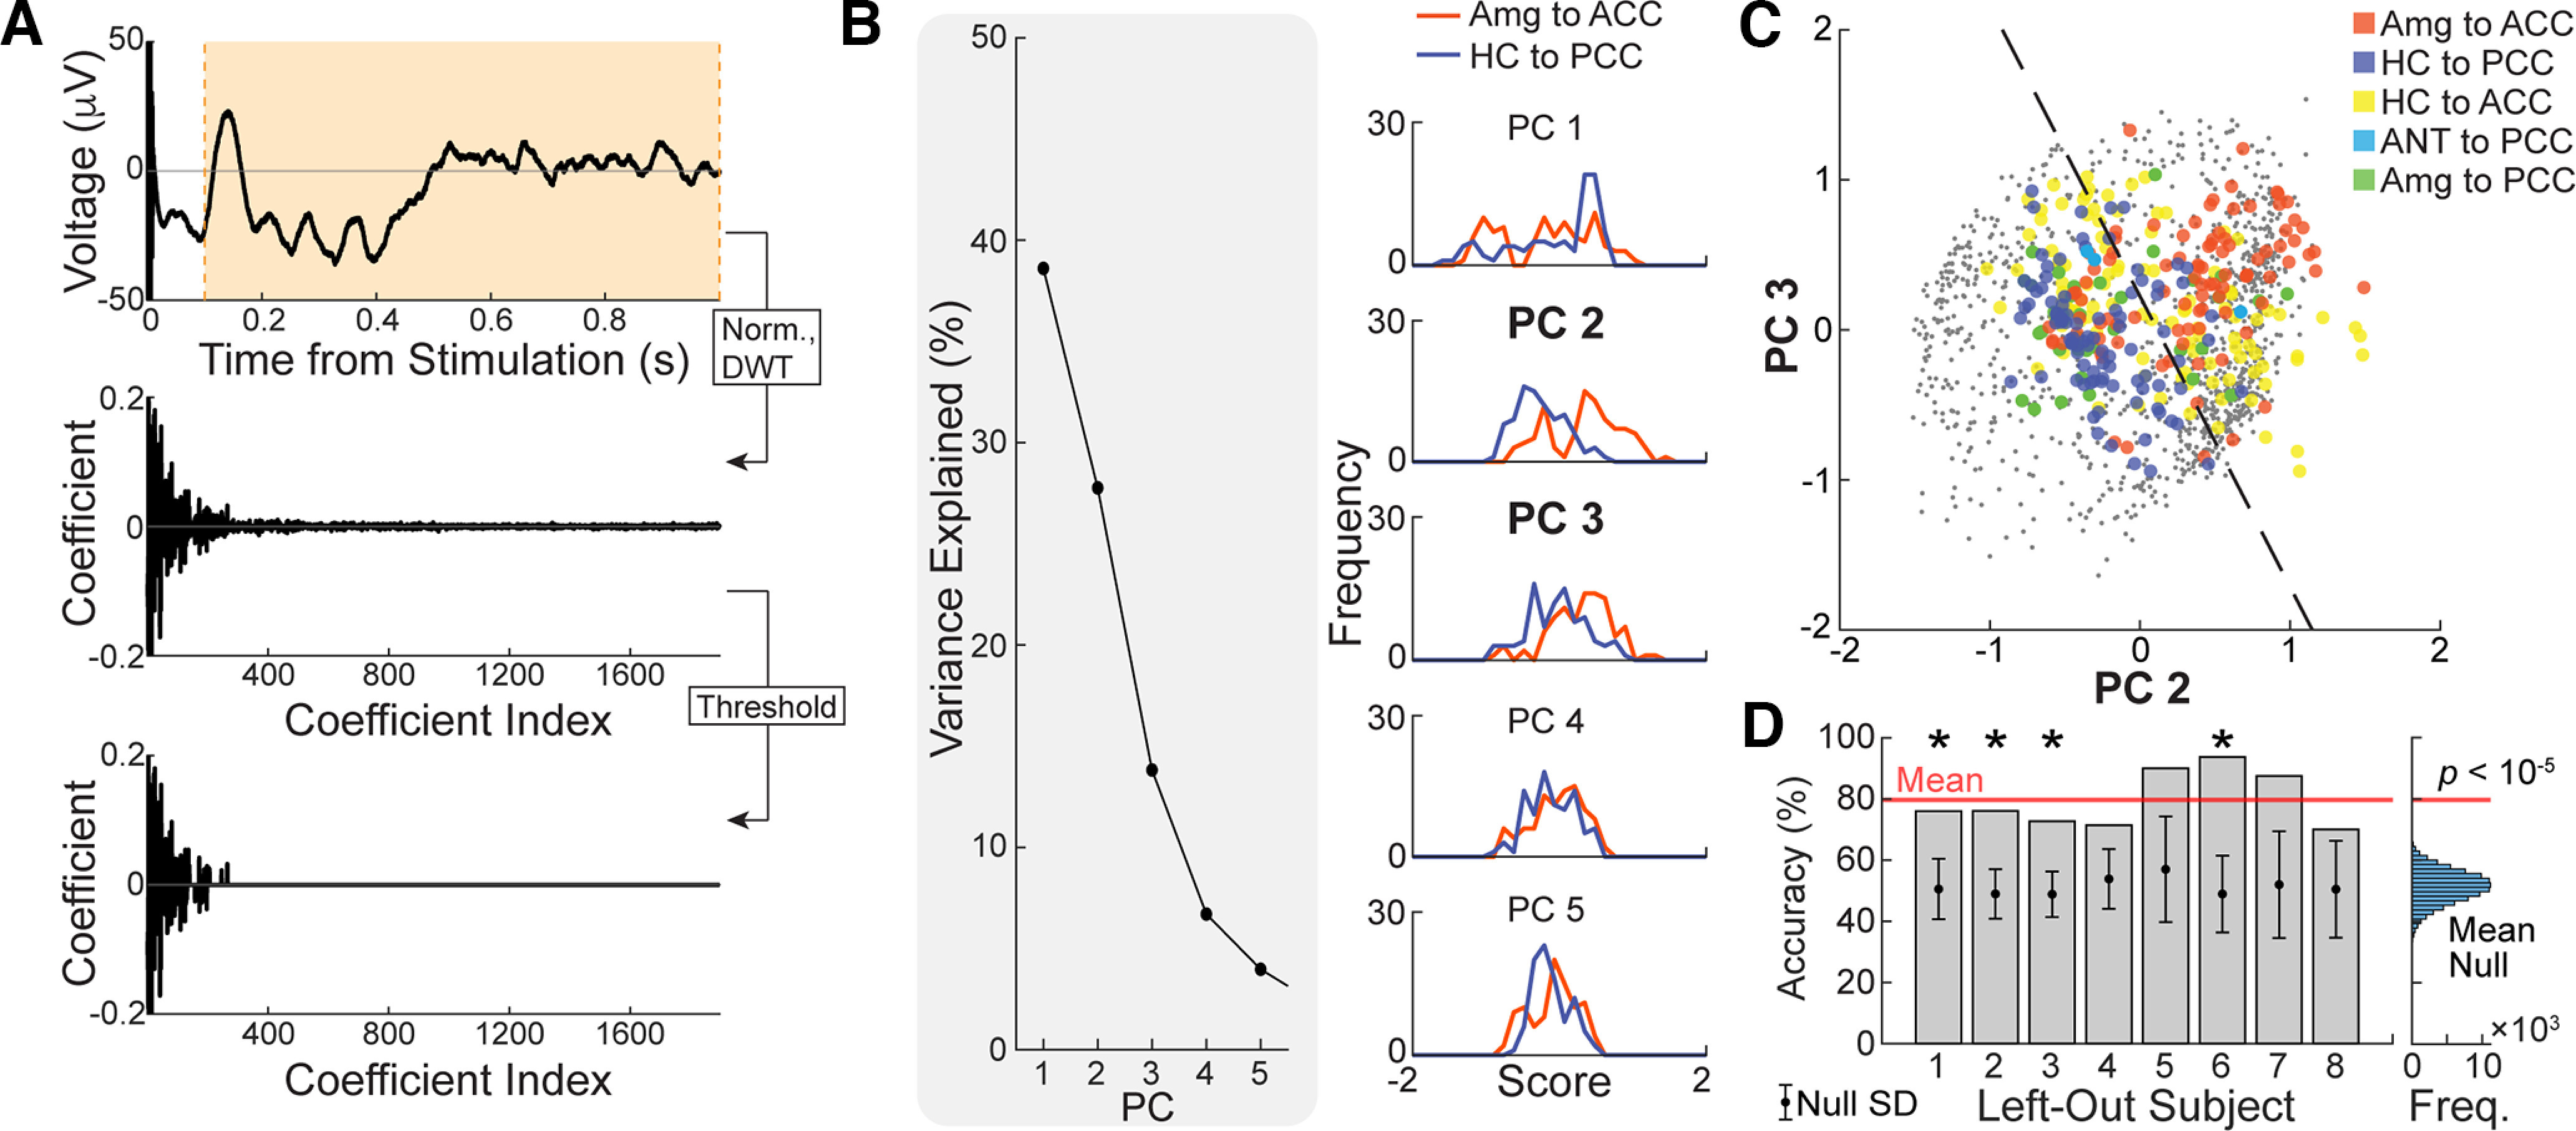
Figure 8.

Similarity metric within tested limbic connections. A, Each significant limbic CCEP was L2 normalized between 100 and 500 ms poststimulation and then subject to a level-8 (maximum) discrete wavelet transform using the fourth Symlet wavelet. All wavelet coefficients below the 95% percentile were set to 0. B, Principal component analysis was performed on all thresholded and discrete wavelet-transformed CCEPs. Left, Percentage of variance explained by each of the first five principal components. Right, Distribution of amygdala-to-ACC and hippocampus-to-PCC scores in each of the first five principal components. C, All limbic CCEPs were projected to the second and third principal components (PCs), which exhibited the greatest independent separation of amygdala-to-ACC and hippocampus-to-PCC CCEPs. Dashed line indicates the decision boundary for linear discriminant analysis between amygdala-to-ACC and hippocampus-to-PCC CCEPs. Training accuracy = 78.0%. D, Leave-one-subject-out cross-validation yielded a mean accuracy of 79.7% (red line). Left, Bars show the test accuracy for each left-out subject, while circle and error bars show the mean and SD of the null test accuracy distribution for the same left-out subject by permutation testing. An asterisk (*) indicates significantly higher accuracy than expected by chance at an FDR of 0.05. Right, The histogram shows the mean cross-validation accuracy, across all subjects, for each permutation of the null model. Cross-validation accuracies for the models trained and tested on filtered temporal data are shown in Extended Data Figure 8-1, for comparison. Freq., Frequency; Norm., Normalized; DWT., Discrete Wavelet Transformed.
