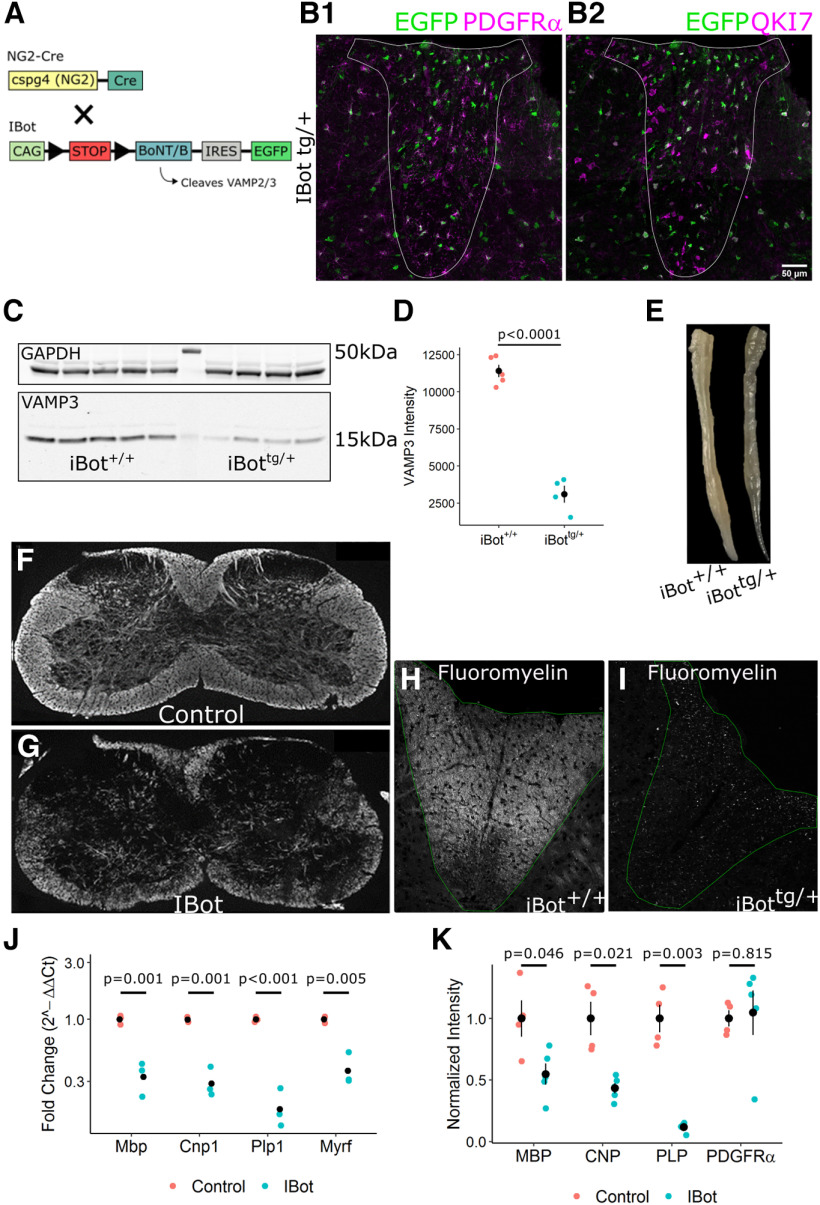
Figure 1.
Developmental hypomyelination in iBottg/+ spinal cords. A, Schematic of iBottg/+NG2cretg/+ animals. B, P13–P14 iBottg/+ dorsal column labeled for GFP and PDGFRα (B1) or QKI7 (B2; scale bar = 50 µm). C, Western blot analysis for VAMP3 (bottom) and GAPDH (top) from P14–P15 iBot+/+ and iBottg/+ spinal cord lysate. D, Quantification of VAMP3 levels normalized to GAPDH in iBot+/+ (8.04 × 10³ ± 498.40) and iBottg/+ (2.76 × 10³ ± 586.16) spinal cords (Welch’s two sample t test, t(5.83) = 11.7, p = 2.87 × 10⁻⁵, n = 5 iBot+/+ and 4 iBottg/+). E, Fixed spinal cords harvested from an iBot+/+ control animal (top) and an iBottg/+ animal (bottom). F, G, Cervical spinal cord sections labeled for MBP in iBot+/+ (F) and iBottg/+ animals (G). H, I, Fluoromyelin staining in the dorsal column of P13–P14 iBot+/+ (H) and iBottg/+ (I) mice. J, qRT-PCR showing decreased expression of Mbp (3-fold decrease), Cnp (3.4-fold decrease), Plp1 (5.4-fold decrease), and Myrf (2.6-fold decrease) in iBottg/+ spinal cords (Welch’s two sample t test for each gene, n = 3 animals per genotype). Expression values are reported as fold change compared with controls plotted on a log10 scale. K, Western blot analysis showing decreased protein levels of MBP (1.8-fold decrease), CNP (2.3-fold decrease), and PLP (8.6-fold decrease) but not PDGFRα in iBottg/+ animals compared with controls (Welch’s two sample t test for each protein, n = 4 animals per genotype). Band intensity shown is normalized to control values after normalization to the reference marker GAPDH. See Movie 1 for video demonstrating motor impairment in an iBottg/+ mouse.

