Figure 3.

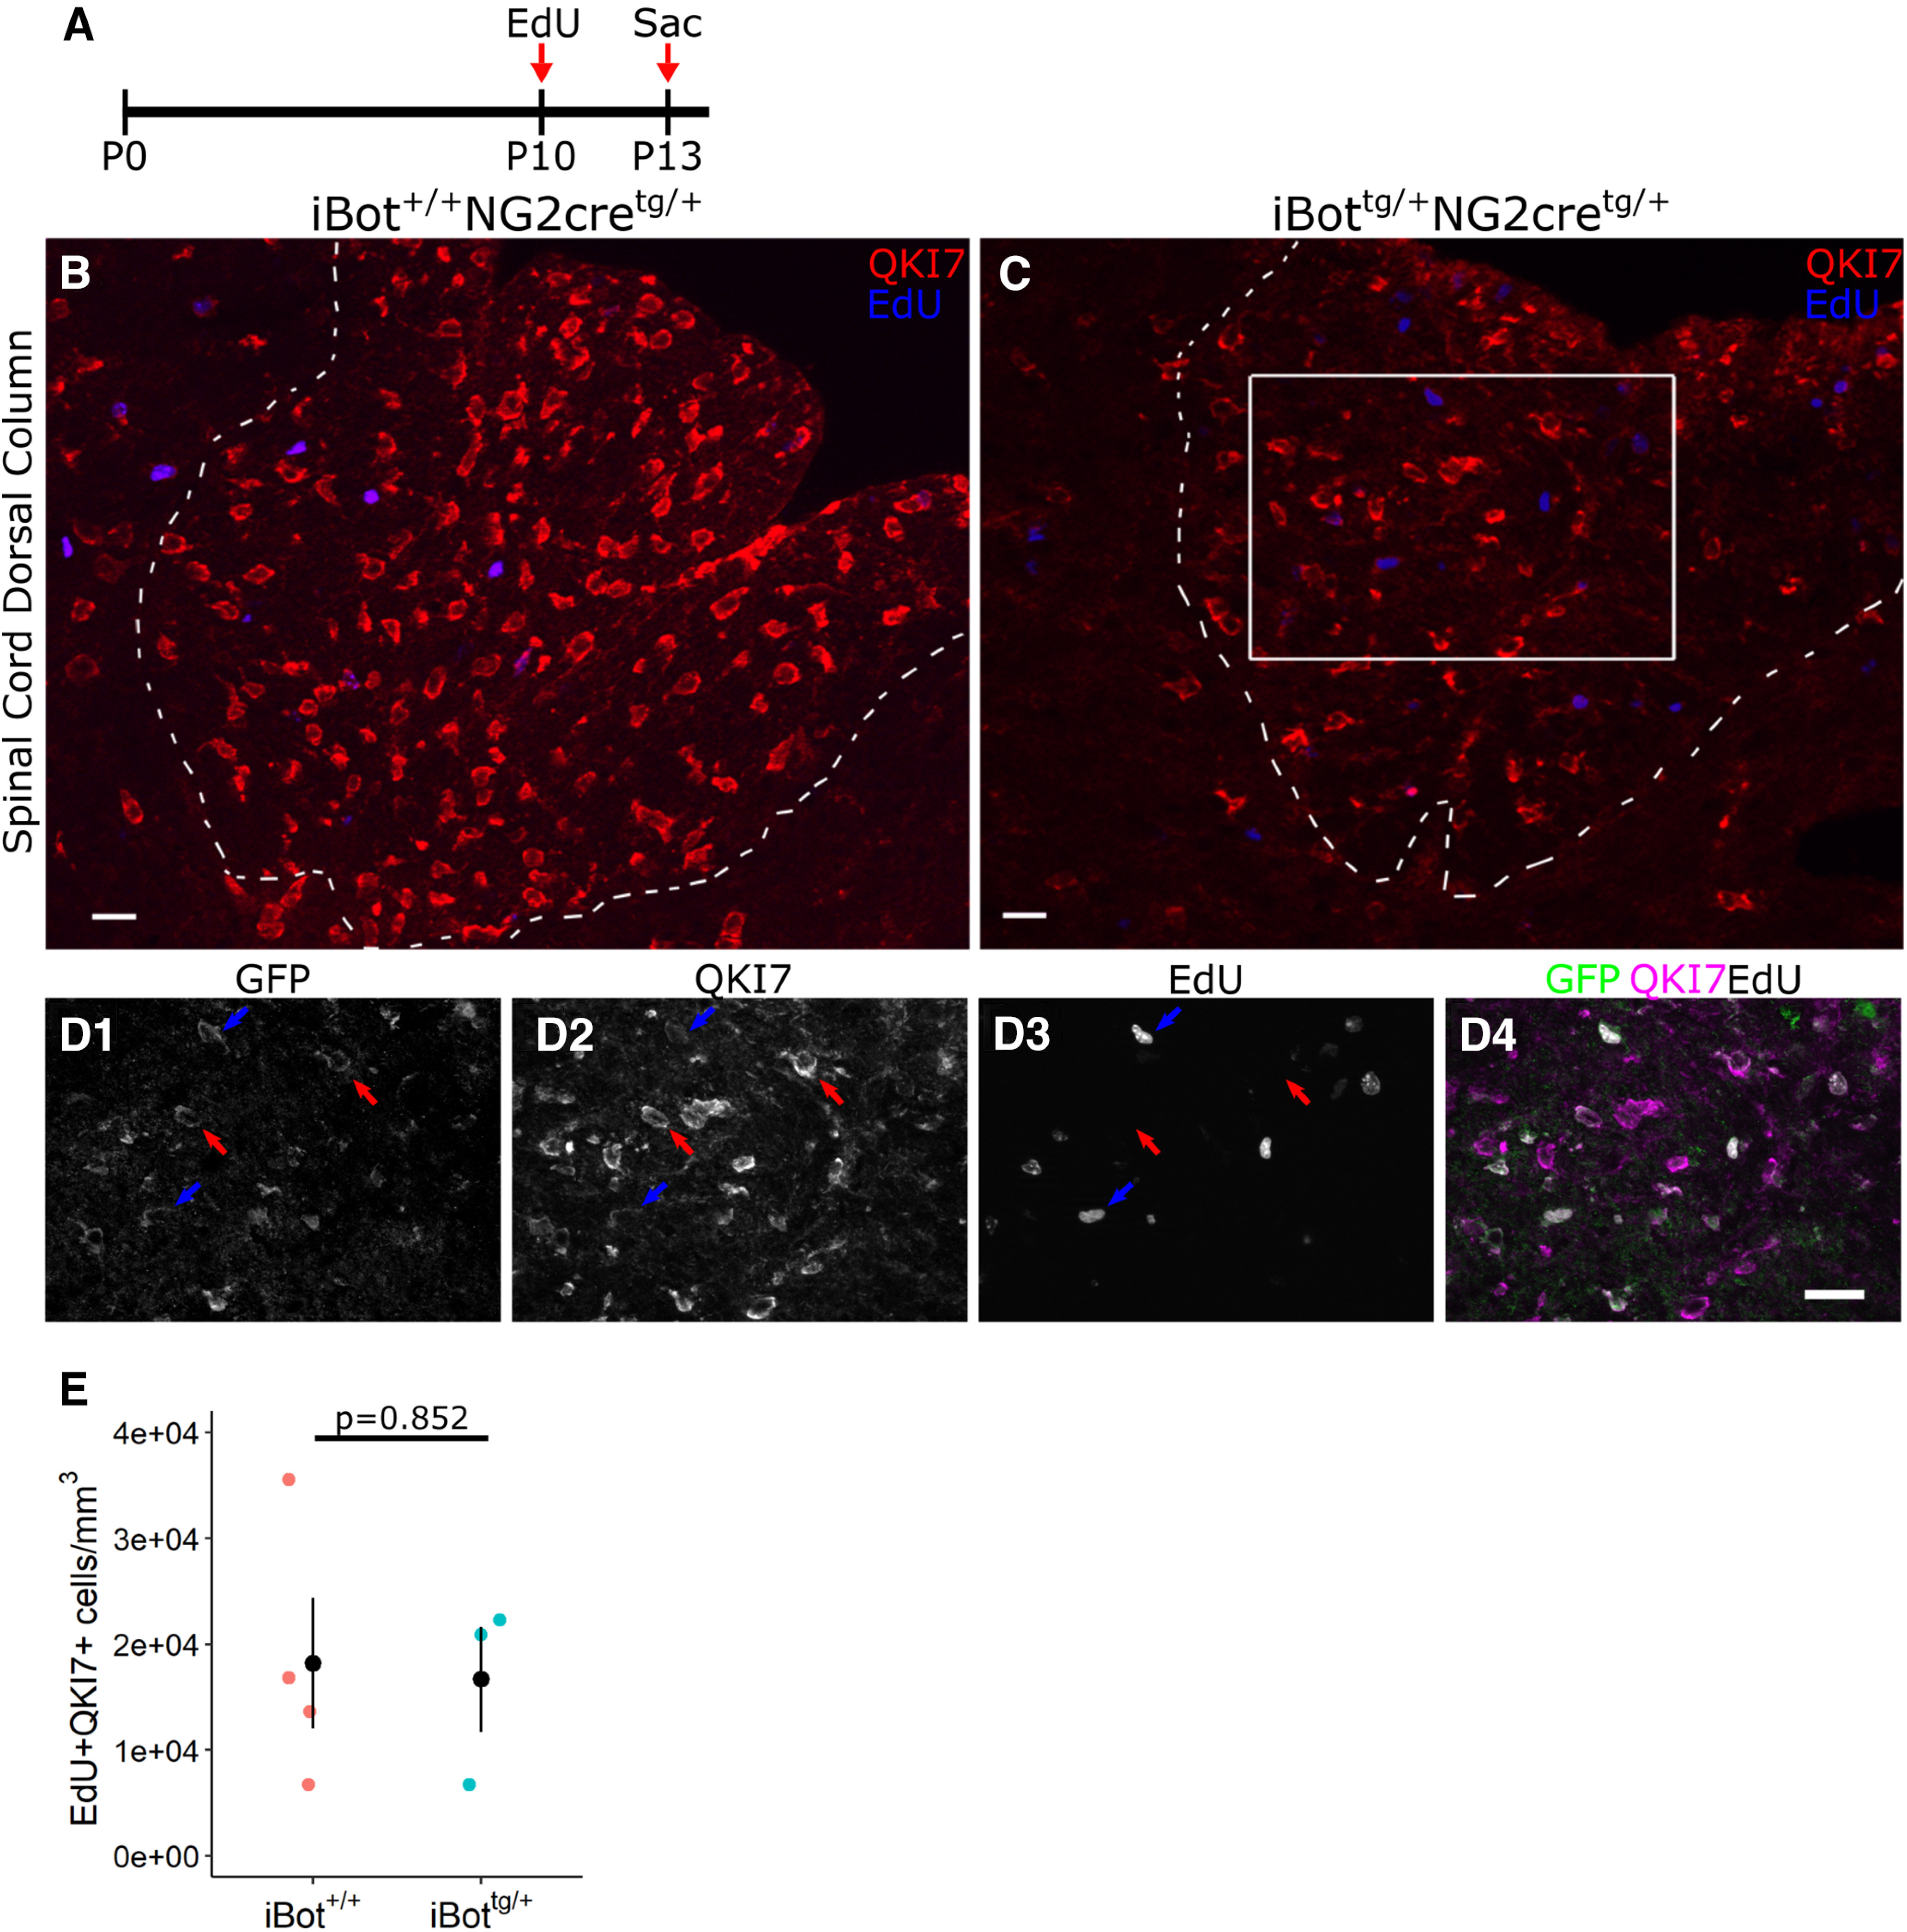
EdU pulse chase labeling of iBottg/+ and control animals from P10–P13. A, Schematic illustrating design of EdU pulse chase experiment. B, C, Double label for QKI7 and EdU in P13 iBot+/+ (B) and iBottg/+ (C) dorsal column. D, Labeling for GFP, QKI7, and EdU from the area marked in C showing GFP+/QKI7+/EdU− OLs (red arrows) and GFP+/QKI7+/EdU+ OLs (blue arrows). E, EdU+/QKI7+ cell density in iBot+/+ (1.82 × 10⁴ ± 6.16 × 10³ cells/mm3) and iBottg/+ dorsal column (1.67 × 10⁴ ± 4.97 × 10³ cells/mm3, Welch’s two sample t test, t(5) = 0.196, p = 0.852, n = 4 iBot+/+ and 3 iBottg/+ animals). Scale bars = 20 µm (B, C), 25 µm (D).
