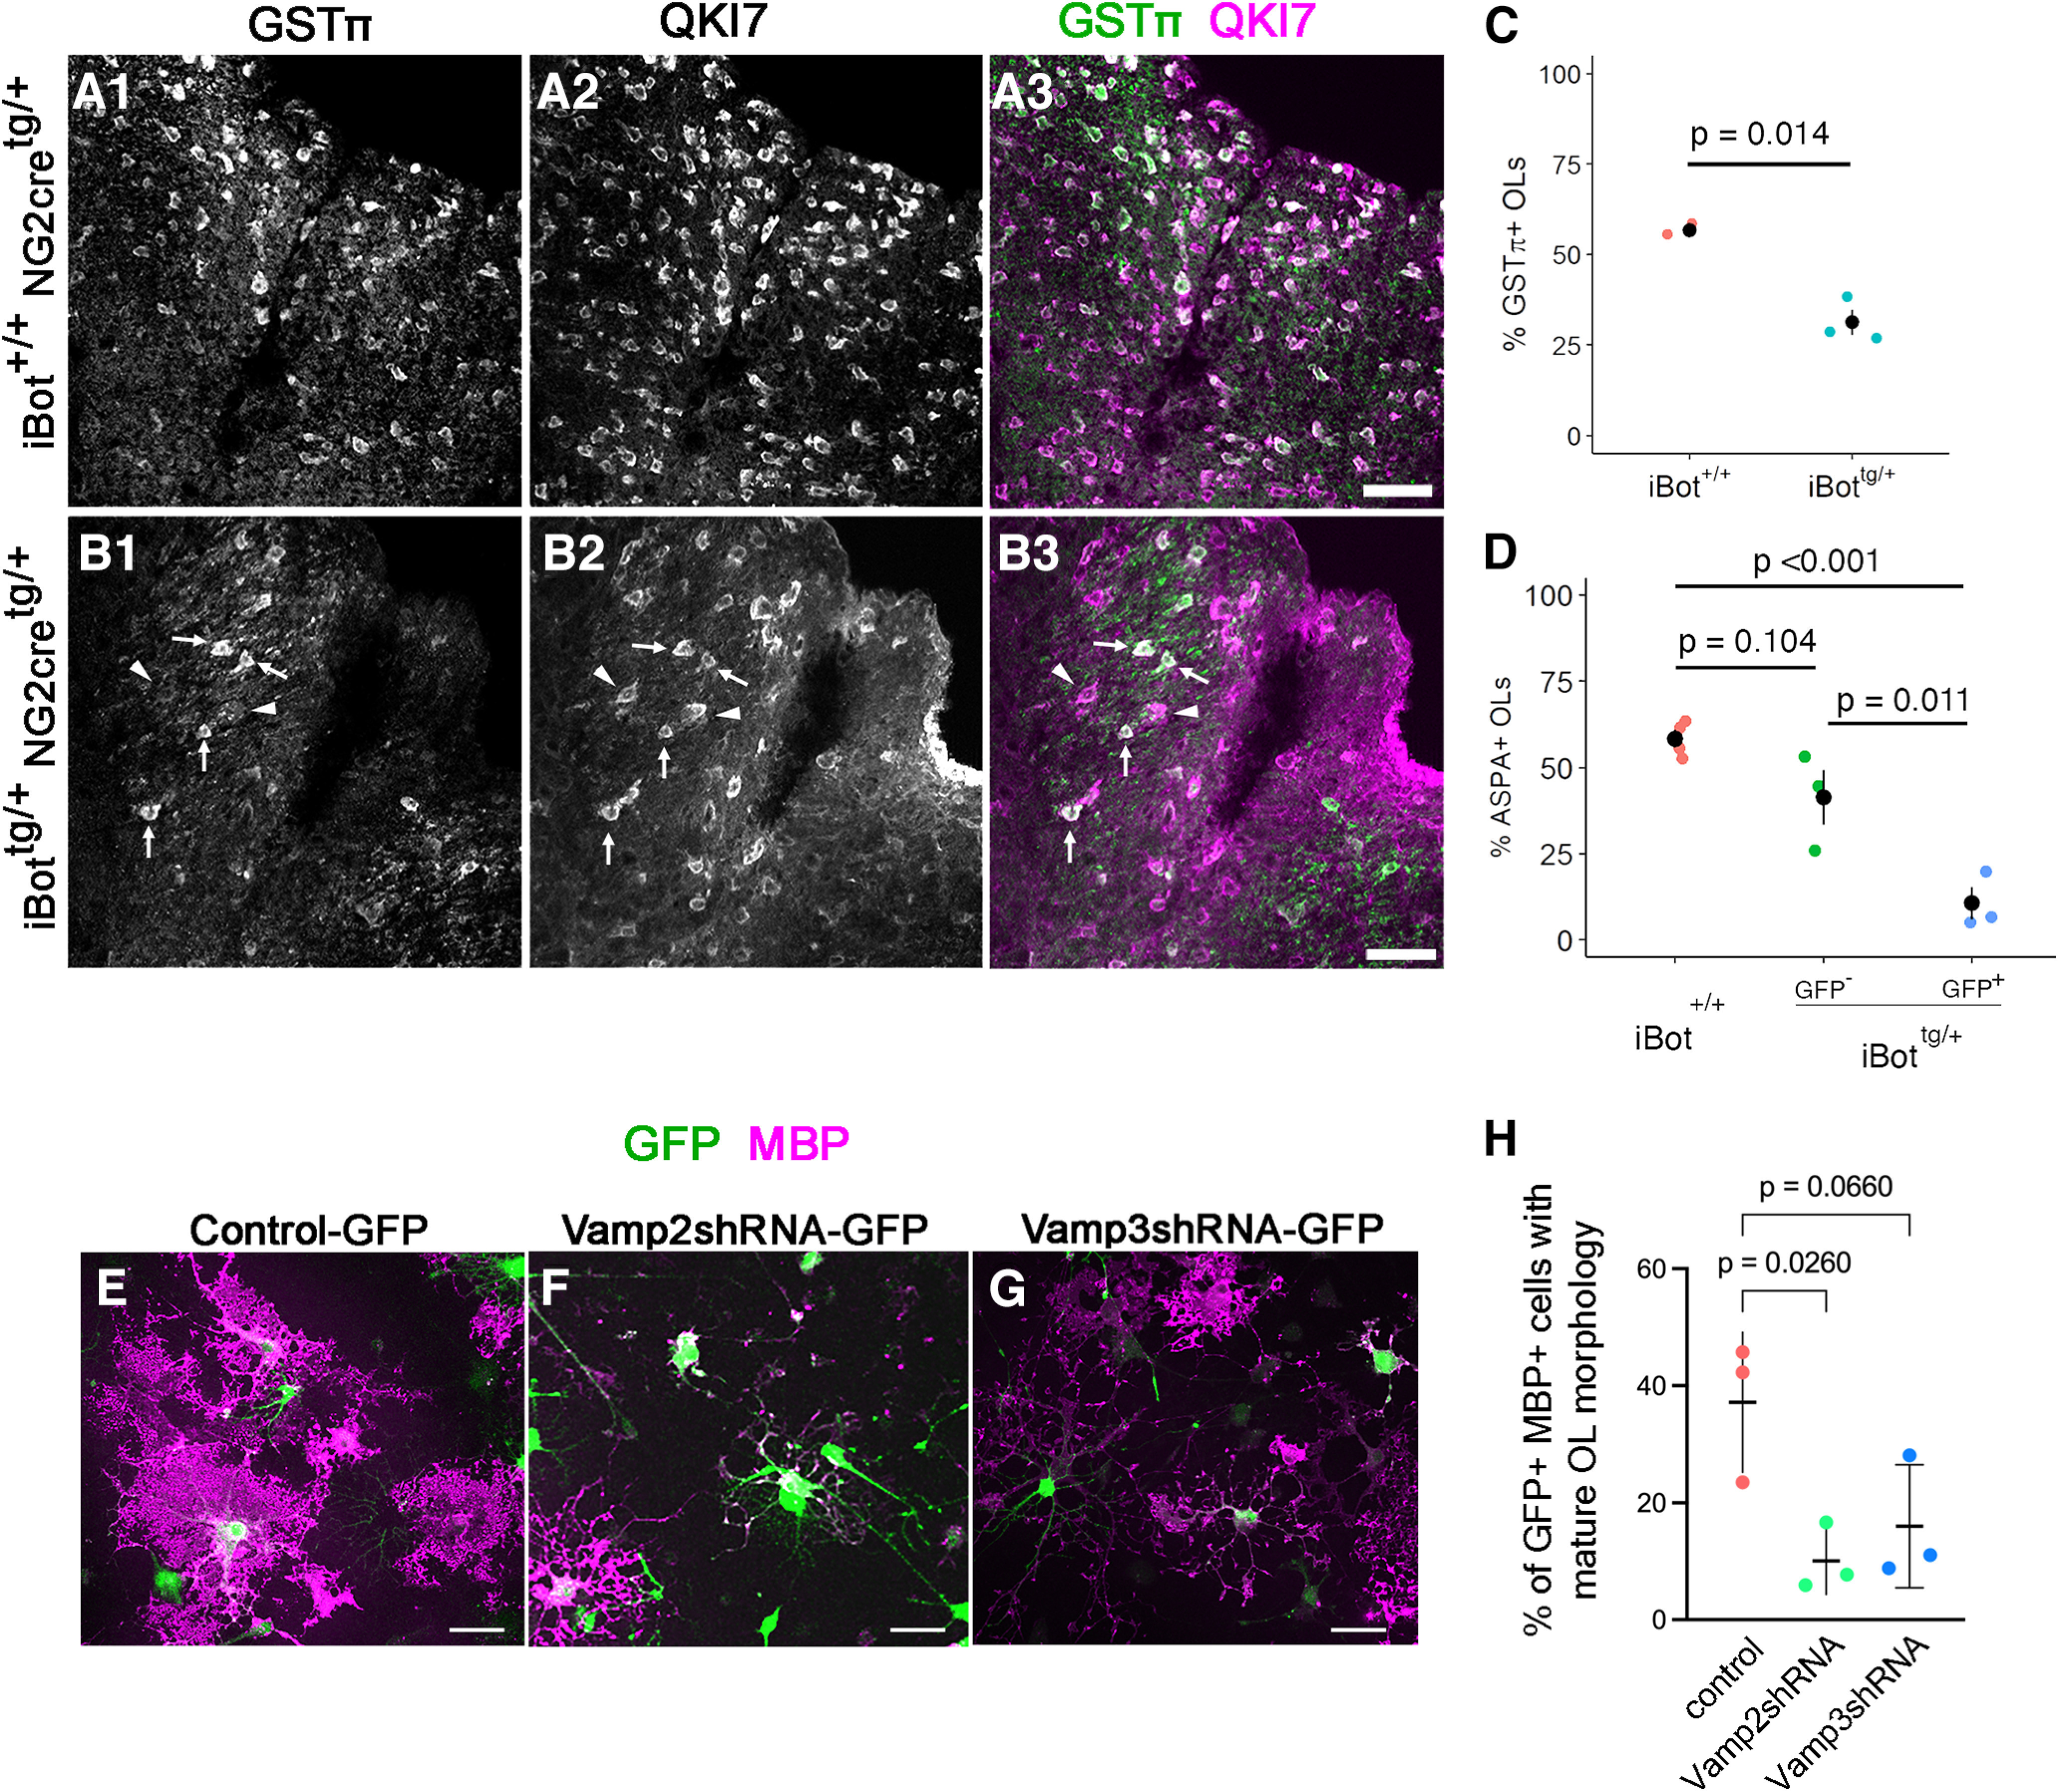
Figure 4.

Defective OL maturation in P13–P14 iBottg/+ dorsal column and following Vamp2/3 knock-down. A, B, Labeling for GSTπ and QKI7 at P13 in iBot+/+ (A) and iBottg/+ dorsal column (B). Arrowheads in B show QKI7+/GSTπ-negative early OLs, and arrows show QKI7+/GSTπ+ mature OLs. C, Percentage of QKI7+ OLs also labeled by GSTπ in iBottg/+ (31.3 ± 3.6%) and iBot+/+ dorsal column (56.6 ± 1.0%, Welch’s two sample t test, t(2.33) = 6.856, p = 0.014, n = 3 animals for each genotype). D, Percentage of QKI7+ OLs that were ASPA+ at P13–P14 in iBot+/+ dorsal column (58.4 ± 2.5%), among GFP− cells in iBottg/+ dorsal column (41.3 ± 8.0%), and among GFP+ cells in iBottg/+ dorsal column (10.6 ± 4.7%, ANOVA, F(2,7) = 23.07, p = 8.30 × 10⁻⁴, Tukey’s HSD post hoc tests, p = 6.55 × 10⁻⁴ for iBot+/+:iBottg/+GFP+). E–G, Dissociated rat spinal cord OPCs transduced with lentivirus encoding control-GFP (E), Vamp2shRNA-GFP (F), or Vamp3shRNA-GFP (G) and stained for MBP after 6 d in differentiation media. H, Proportion of MBP+ GFP+ cells with mature OL morphology, exhibiting membranous processes. One-way ANOVA, Brown–Forsythe test, F(2,6) = 6.340, p = 0.0331. Scale bars = 50 µm.
