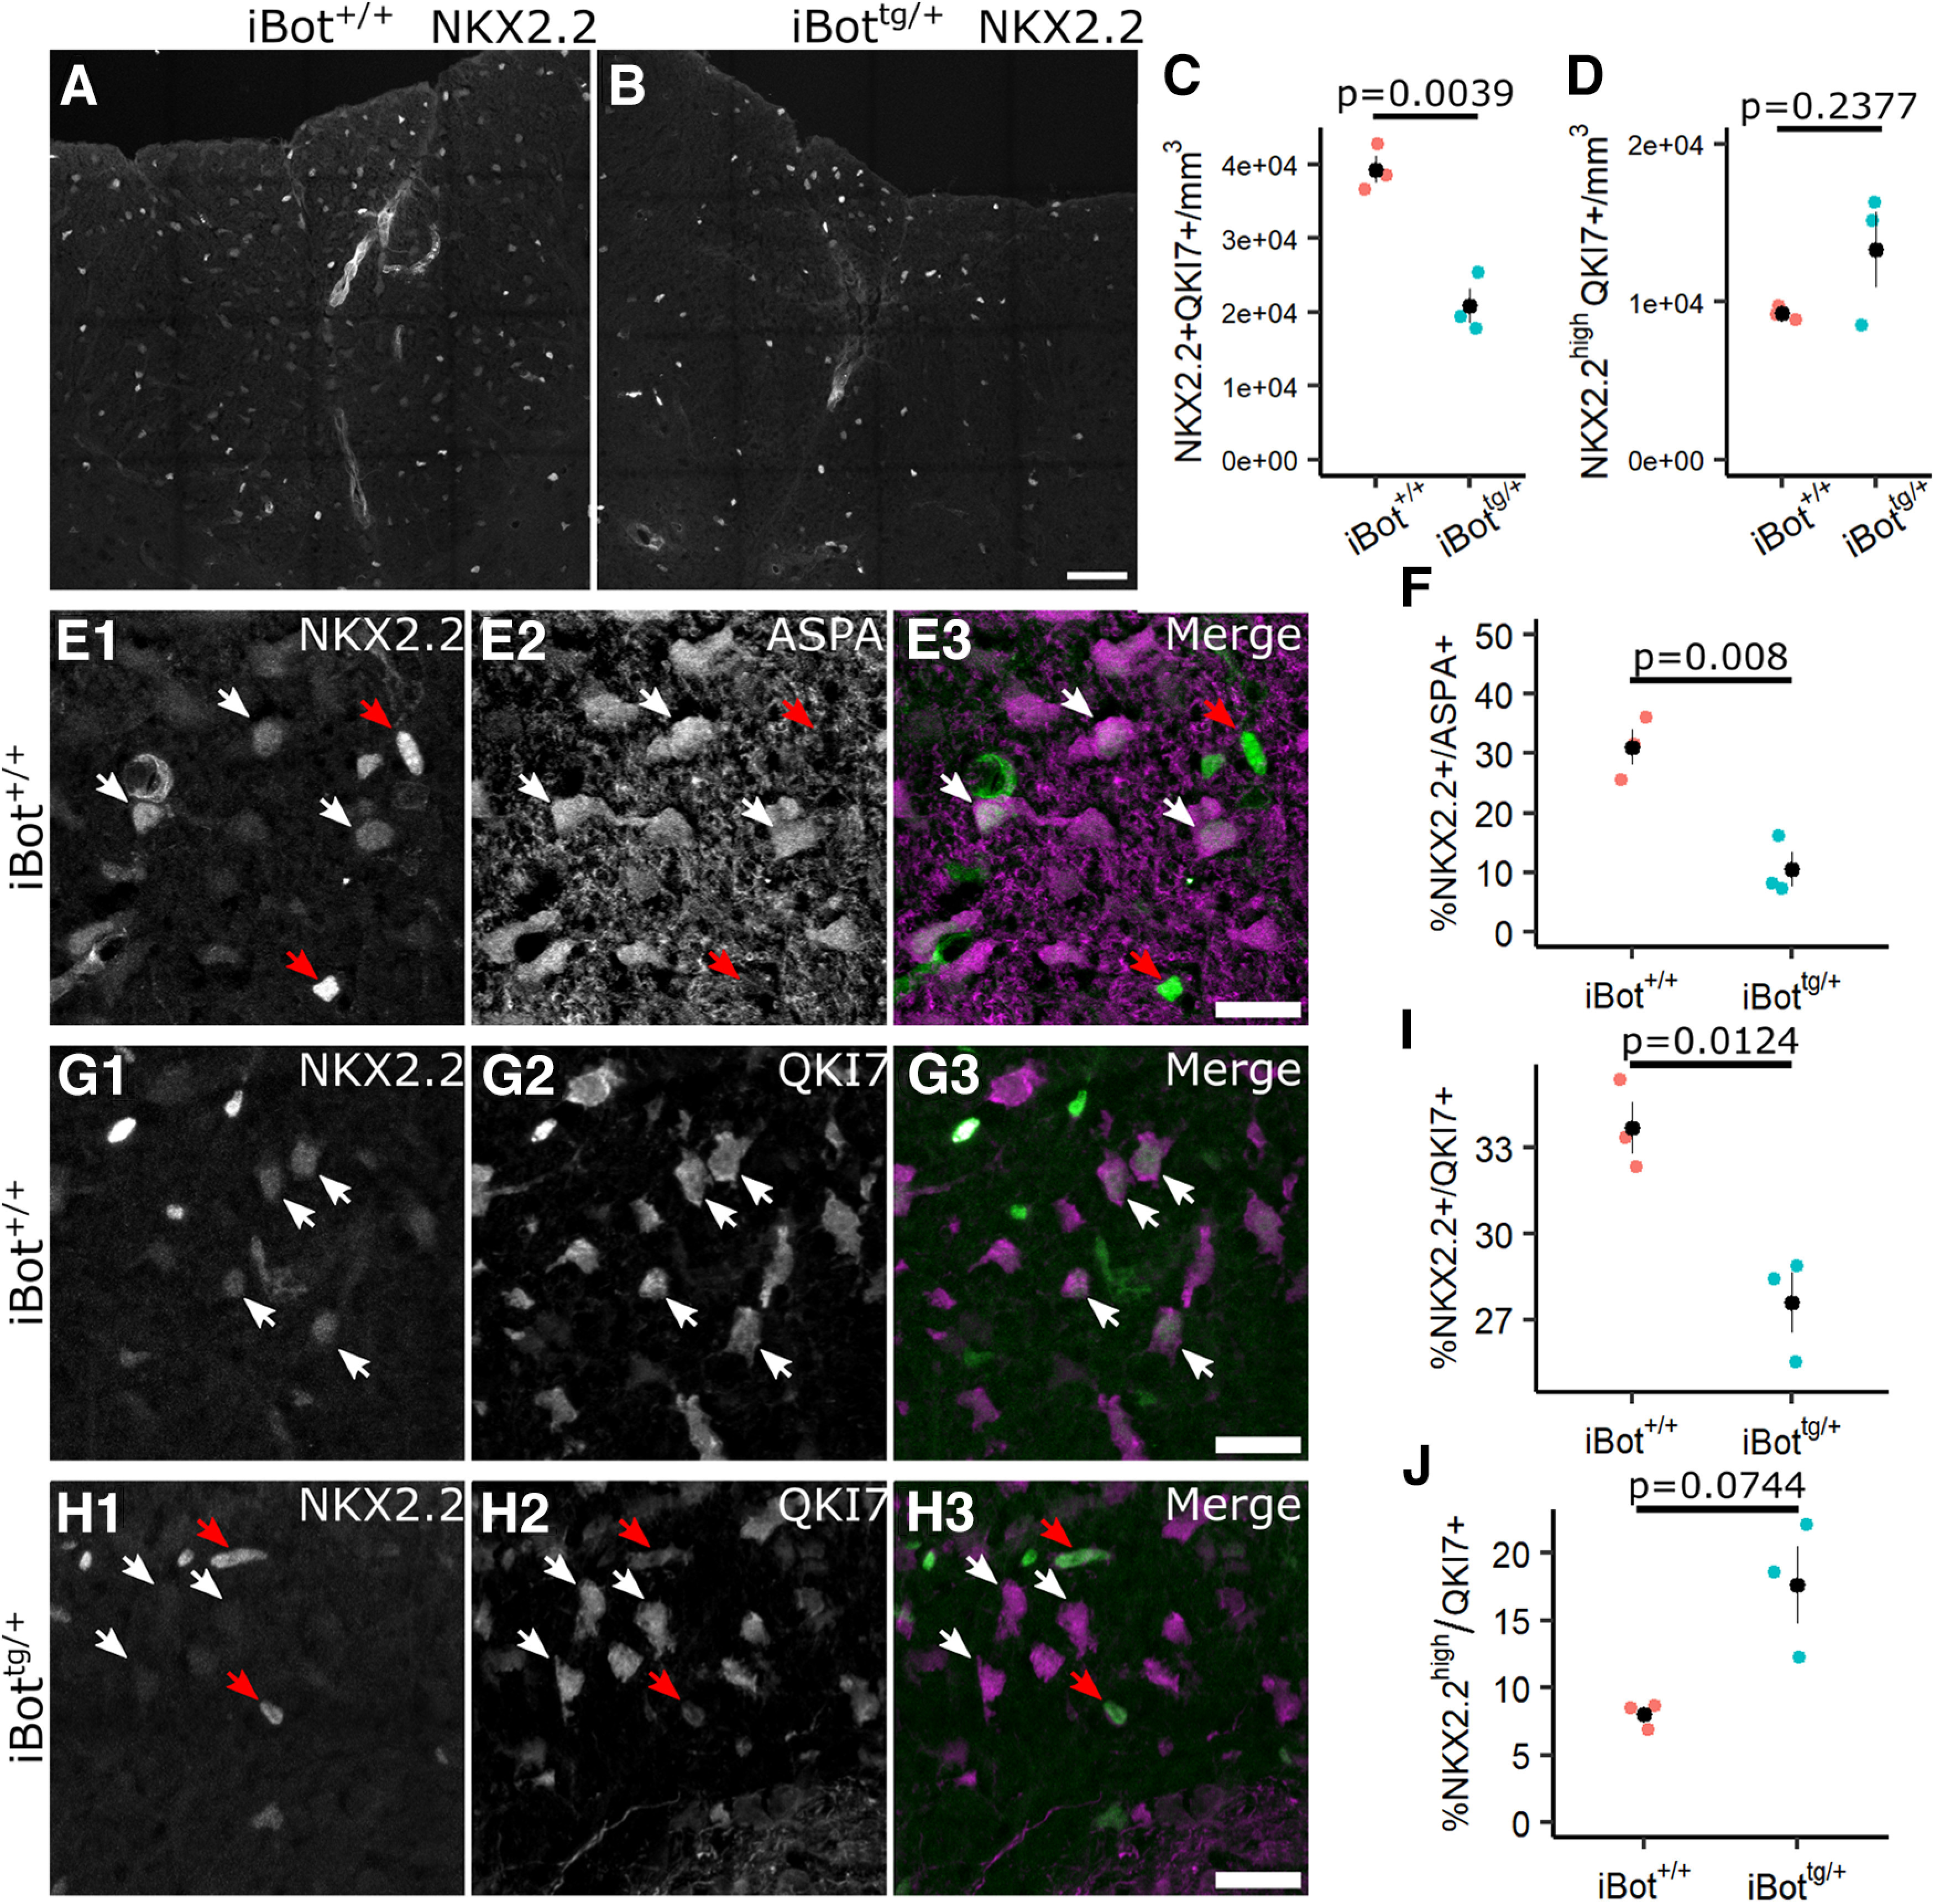
Figure 5.

Expression of NKX2.2 among QKI7+ and ASPA+ OLs in iBot+/+ and iBottg/+ dorsal column. A, B, NKX2.2 labeling in spinal cord sections from P13 to P14 iBot+/+ (A) and iBottg/+ (B) mice. C, Density of NKX2.2+/QKI7+ cells in dorsal column of iBot+/+ (3.93 × 10⁴ ± 1.80 × 10³ cells/mm3) and iBottg/+ mice (2.08 × 10⁴ ± 2.30 × 10³ cells/mm3; t(3.79) = 6.31, p = 0.0039). D, Density of NKX2.2high/QKI7+ in dorsal column of iBot+/+ (9.29 × 10³ ± 263.90 cells/mm3) and iBottg/+ mice (1.33 × 10⁴ ± 2.42 × 10³ cells/mm3; t(2.05) = −1.65, p = 0.2377). E, Labeling for NKX2.2 and ASPA in the dorsal column of iBot+/+ control mice showing NKX2.2high/ASPA− cells (red arrows) and NKX2.2low/ASPA+ cells (white arrows). F, Quantification of the percentage of ASPA+ OLs with detectable nuclear NKX2.2 expression in iBot+/+ (31.06 ± 3.05%) and iBottg/+ (10.53 ± 2.83%) dorsal column (t(3.98) = 4.93, p = 0.008). G, Immunofluorescent labeling for NKX2.2 and QKI7 in iBot+/+ dorsal column showing NKX2.2low OLs (white arrows). H, Labeling for NKX2.2 and QKI7 in iBottg/+ dorsal column showing NKX2.2high (red arrows) and NKX2.2− OLs (white arrows). I, Quantification of the percentage of NKX2.2+ QKI7+ OLs in iBot+/+ (33.68 ± 0.90%) and iBottg/+ dorsal column (27.60 ± 1.05%; t(3.90) = 4.40, p = 0.0124). J, Percentage of NKX2.2high/QKI7+ OLs in iBot+/+ (8.01 ± 0.55%) and iBottg/+ dorsal column (17.64 ± 2.88%; t(2.15) = −3.28, p = 0.0744). All statistical tests done using Welch’s two sample t test with n = 3 animals for each genotype. Scale bars = 50 µm (A, B), 20 µm (E, G, H).
