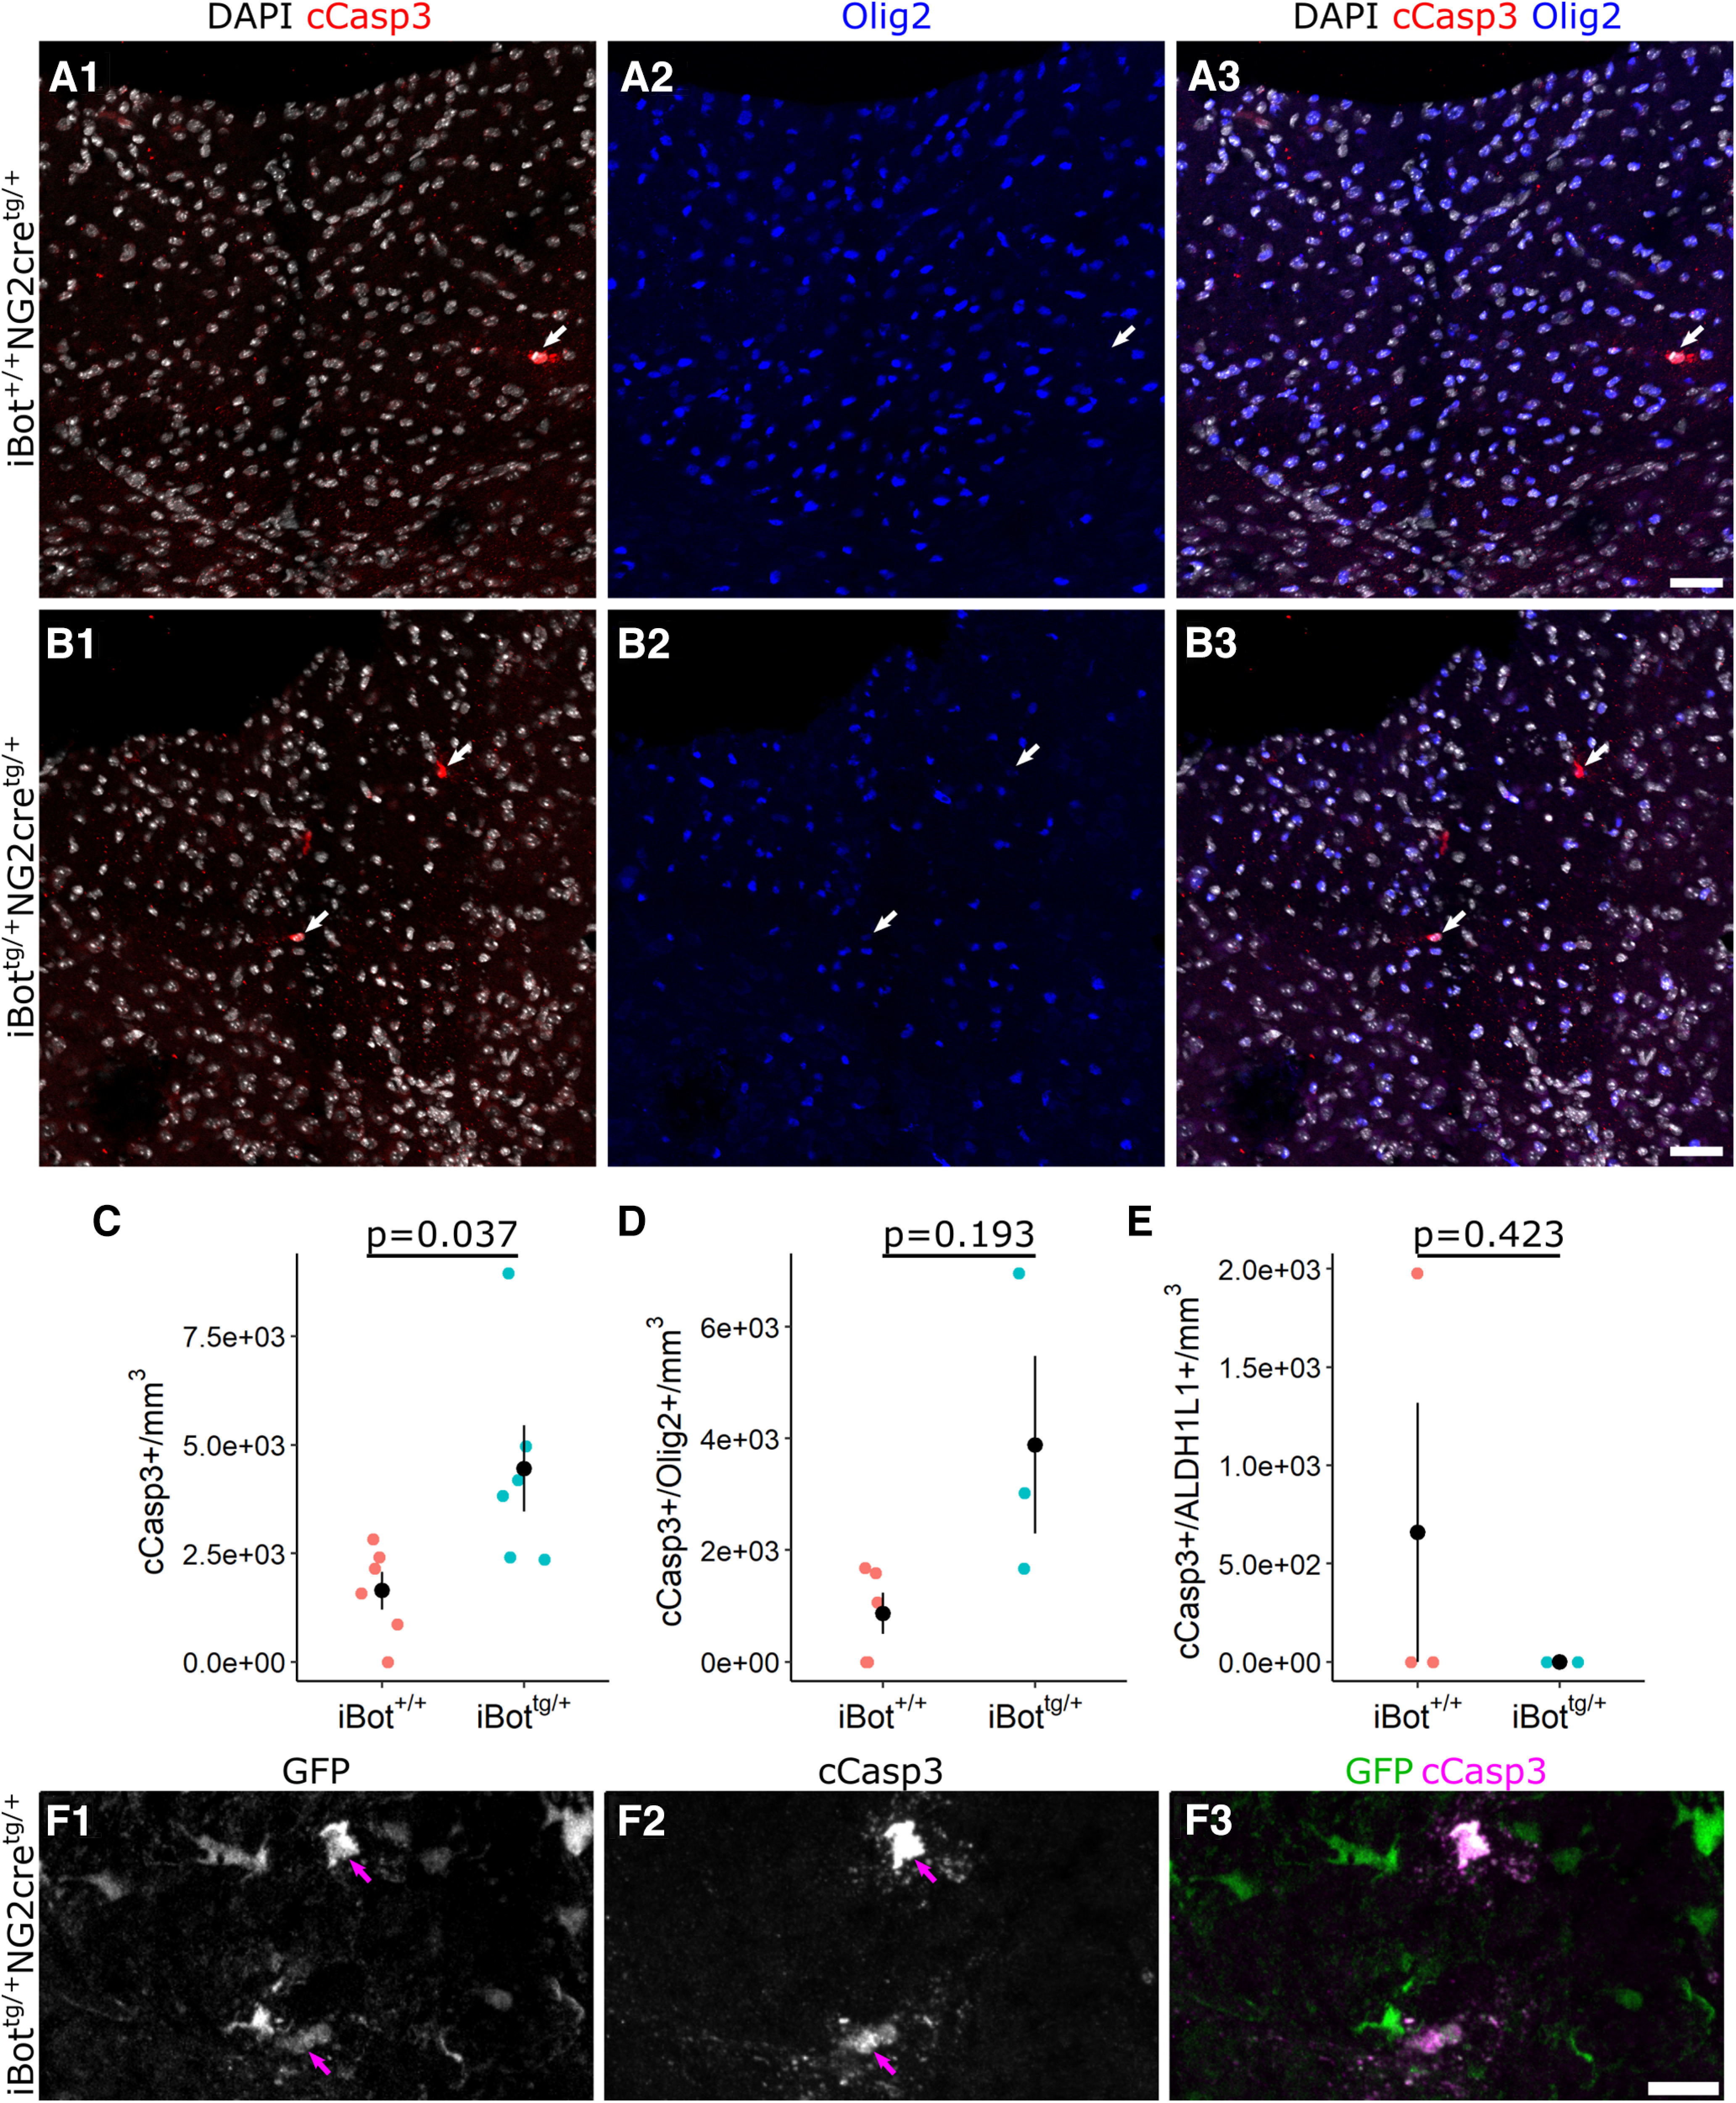
Figure 6.

Cleaved caspase 3 labeling for apoptotic cells in P13 dorsal column. A, B, Double label for cCasp3 and Olig2 with DAPI in dorsal column of P13 iBot+/+ (A) and iBottg/+ mice (B) showing cCasp3+ apoptotic cells (arrows). C, cCasp3+ cell density in the dorsal column of P13 iBot+/+ mice (1.64 × 10³ ± 429.9 cells/mm3) and iBottg/+ mice (4.45 × 10³ ± 992.8 cells/mm3, Welch’s two sample t test, t(6.8) = −2.60, p = 0.036, n = 6 iBot+/+ and 6 iBottg/+ animals). D, Density of double labeled cCasp3+/Olig2+ cells in the dorsal column of P13 iBot+/+ mice (868.8 ± 369.6 cells/mm3) and iBottg/+ mice (3.89 × 10³ ± 1.59 × 10³ cells/mm3, Welch’s two sample t test, t(2.22) = −1.852, p = 0.193, n = 5 iBot+/+ and 3 iBot tg/+ animals). E, Density of double labeled cCasp3+/ALDH1L1+ cells in the dorsal column of P13 iBot+/+ mice (659.4 ± 659.4 cells/mm3) and iBottg/+ mice (0 cells/mm3, Welch’s two sample t test, t(2) = 1, p = 0.4226, n = 3 animals for each genotype). F, cCasp3+/GFP+ double labeled cells (arrows) in P13 iBottg/+ dorsal column. Scale bars = 50 µm (A, B), 10 µm (F).
