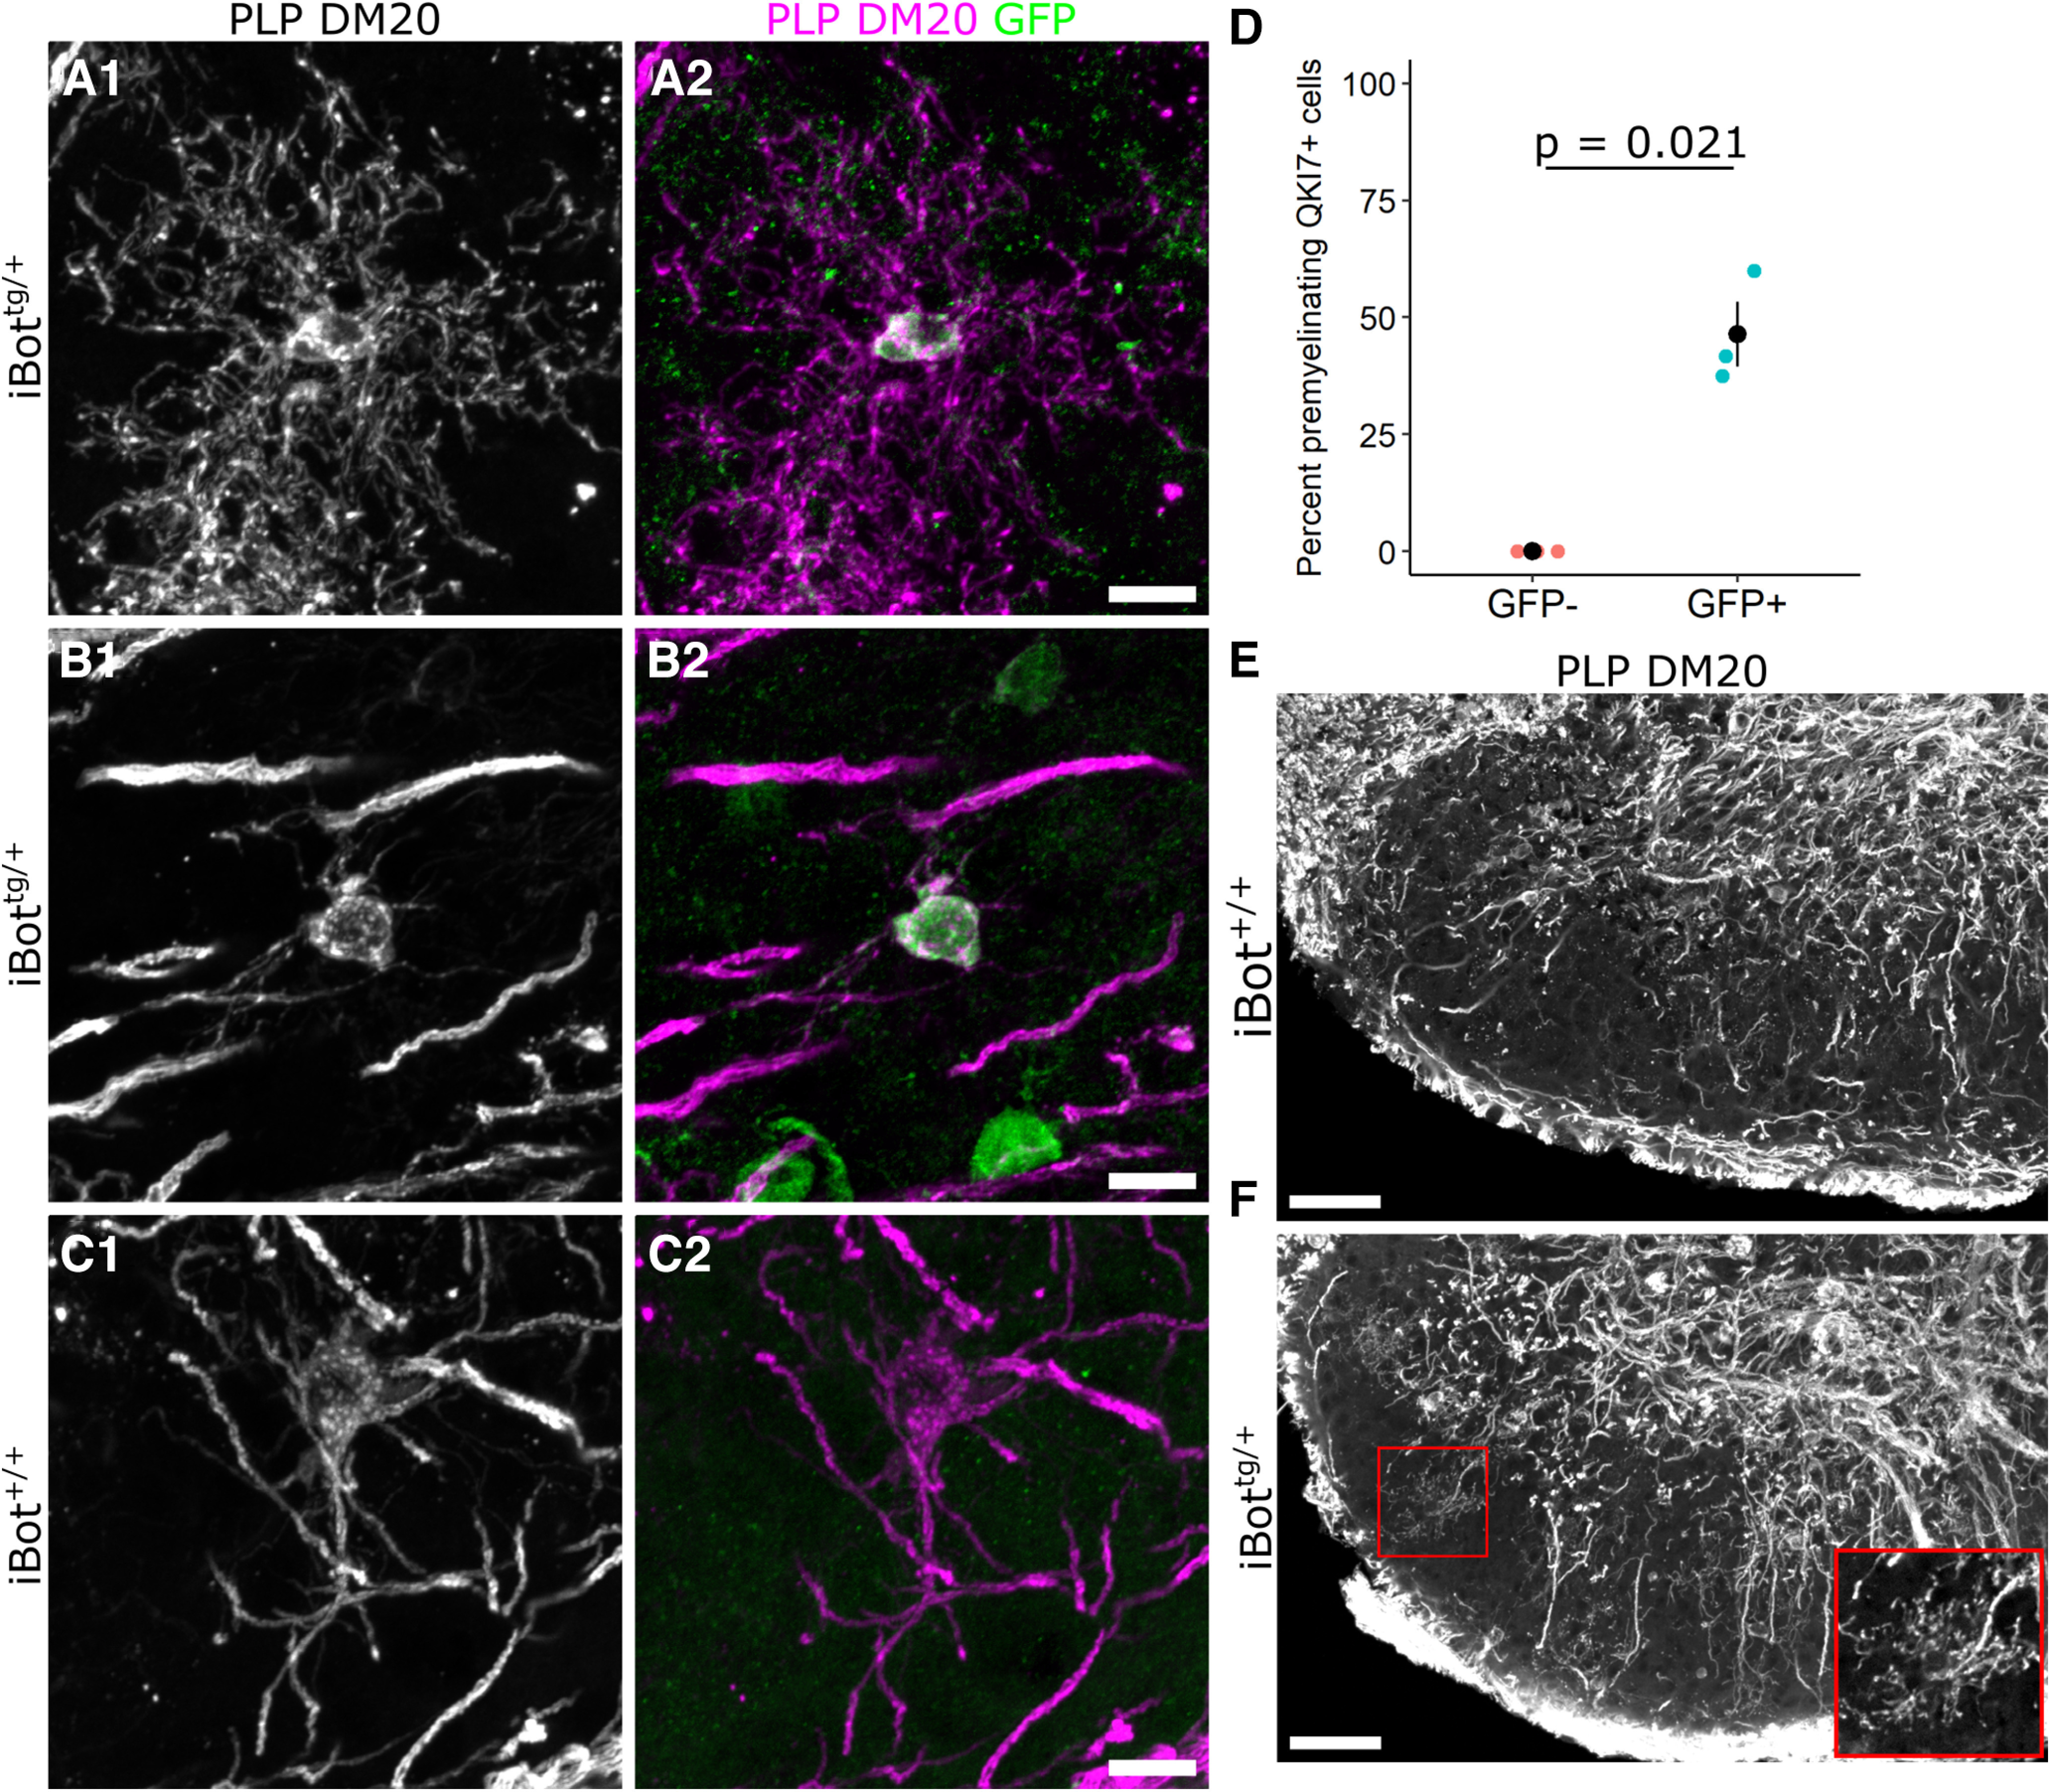
Figure 7.

Morphologic features of iBottg/+ and iBot+/+ OLs in the dorsal horn at P13. A–C, Double label for PLP/DM20 and GFP in iBottg/+ (A, B) and iBot+/+ mice (C) showing a premyelinating OL (A) or myelinating OLs (B, C) in the dorsal horn at P13. D, Percentage of QKI7+ OLs scored as having a premyelinating morphology among GFP− OLs (0%) and GFP+ OLs (46.4 ± 6.9%, Welch’s two sample t test, t(2) = −6.712, p = 0.021, n = 3 iBottg/+ animals, cells were scored from two different images taken in the dorsal horn of each animal). E, F, Low-magnification images of PLP/DM20 labeling in the dorsal horn of iBot+/+ (E) and iBottg/+ (F) mice at P13. Inset shows a magnified view of the premyelinating OL from the region outlined in red (F). γ Was adjusted to 0.5 (E, F) to better visualize premyelinating OLs. Scale bars = 10 µm (A–C), 50 µm (E, F).
