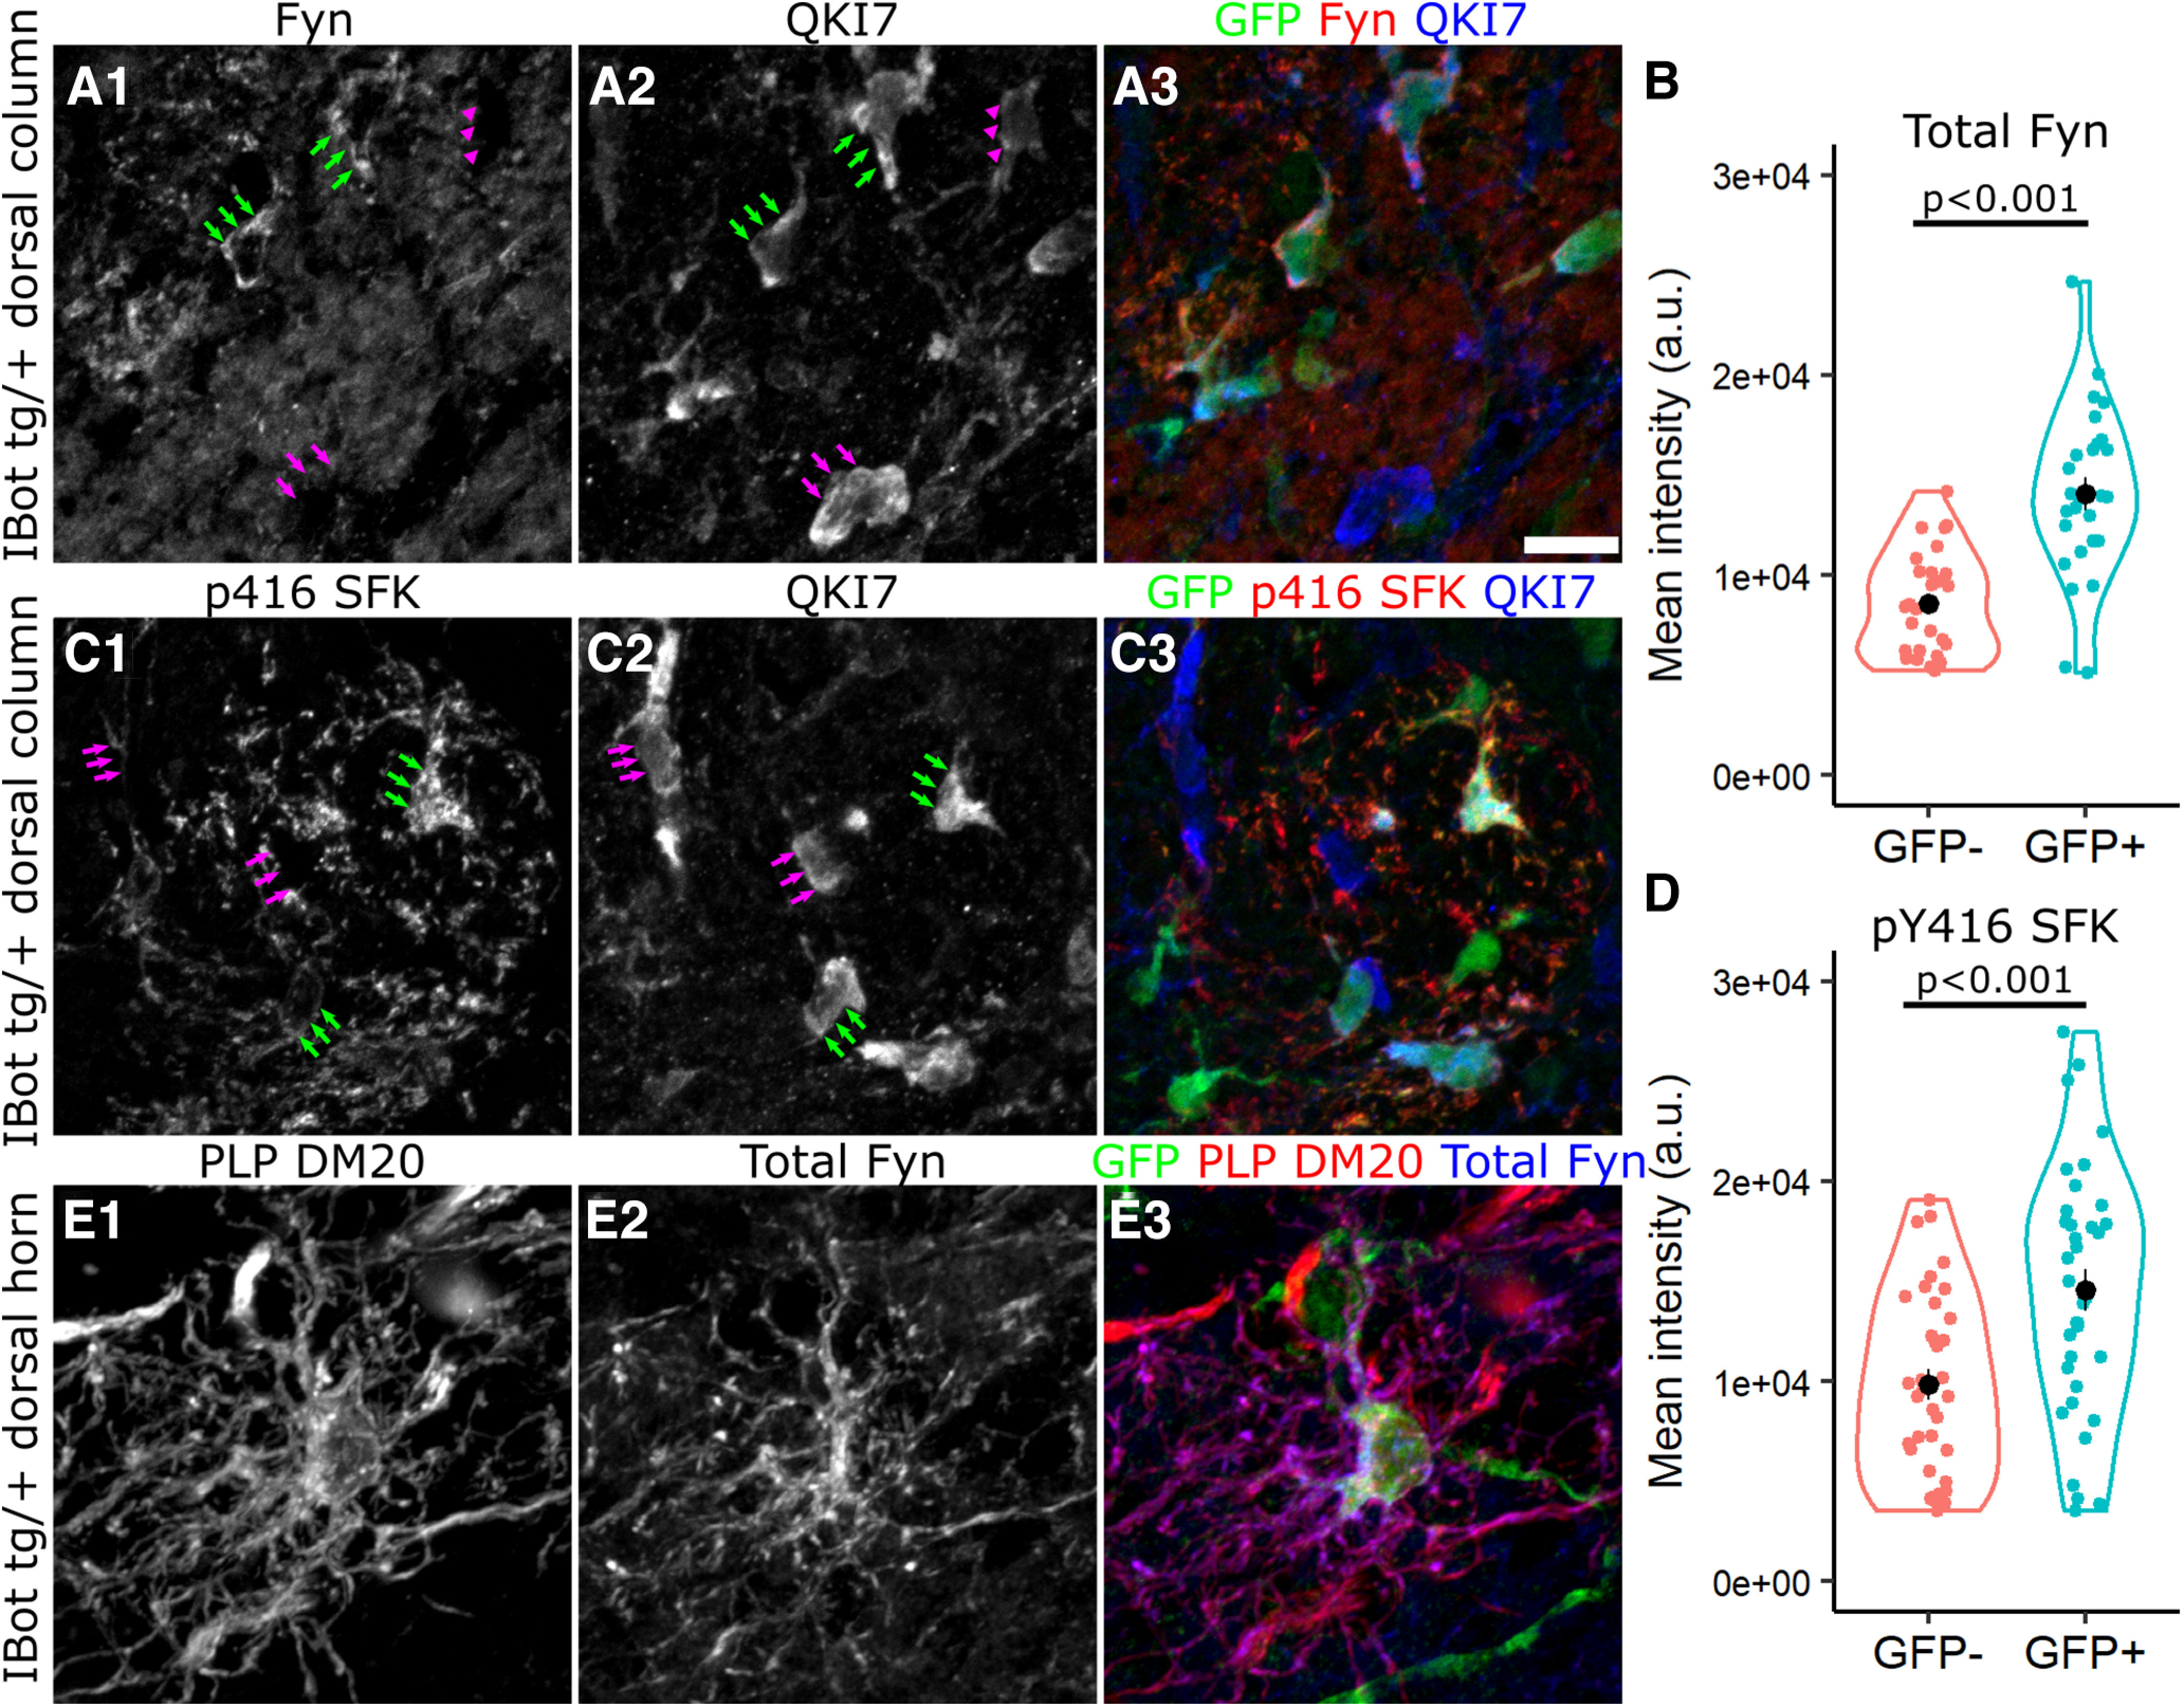
Figure 8.

Fyn is highly expressed throughout the soma and processes of iBottg/+ OLs. A, C, Labeling for QKI7, GFP and either Fyn (A) or p416 SFK (C) around the border of iBottg/+ (GFP+, green arrows) and iBot+/+ OLs (GFP−, magenta arrows) in iBottg/+ corticospinal tract. B, Average fluorescence intensity of Fyn staining along the edge of GFP− (8.61 × 10³ ± 495.1 a.u.) and GFP+ (1.41 × 10⁴ ± 819.3 a.u.) OLs in the dorsal column of iBottg/+ animals (Welch’s two sample t test, t(42.76) = −5.70, p = 1.03 × 10⁻⁶, n = 27 cells per condition from 3 iBottg/+ animals). D, Average fluorescence intensity of p416 SFK staining along the edge of GFP− (9.83 × 10³ ± 757 a.u.) and GFP+ OLs (1.45 × 10⁴ ± 1.03 × 10³ a.u., Welch’s two sample t test, t(64.13) = −3.679, p = 4.81 × 10⁻⁴, n = 36 cells per condition from 4 iBottg/+ animals). E, GFP+ premyelinating OL labeled for PLP/DM20, Fyn, and GFP in P13 iBottg/+ dorsal horn. Scale bar = 10 µm (A, C).
