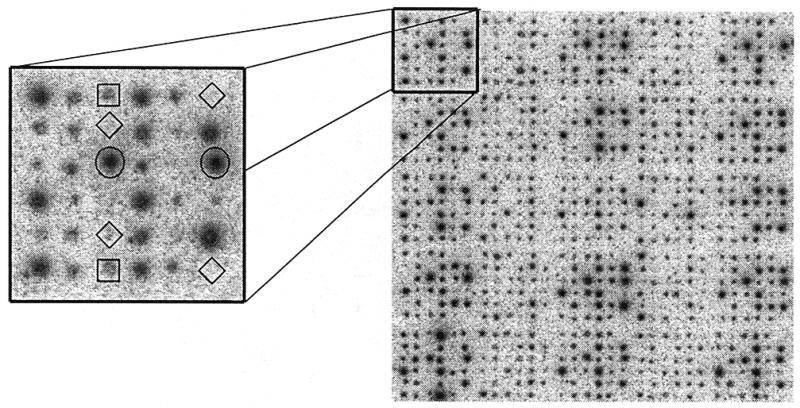
Figure 1.

Segment from a 96 × 144 spot image of a cDNA microarray. The enlarged area (left) shows the spotting pattern (6 × 6 spots) produced by a single pin. Besides the different mouse clones (two spots each) the pattern contains four empty or background spots (diamonds), two spots from the constant Arabidopsis control (circles) and two spots belonging to the Arabidopsis dilution control series (squares). The dilution series consists of six steps, each corresponding to a 2-fold dilution. The gray levels in both graphics are presented on a logarithmic scale in order to give a better impression of the fuzzy boundaries of individual spots.
